|
November 2011
Article
AutomatedBuildings.com
|
[an error occurred while processing this directive]
(Click
Message to Learn More)
|
|
Submetering for
Improved Building Operations & Maintenance Performance
Whether designed in or
retrofitted, submeters are installed
on the “building side” of the main utility meter to measure energy
usage from the enterprise level all the way down to a single device or
circuit.
|

Don Millstein,
President and CEO
E-Mon
|
Facility
operators need ways to operate more efficiently,
cost-effectively and with less downtime. When it comes to proactively
managing energy consumption and demand, electric submeters and energy
intelligence software are rapidly becoming the high-tech tools of
choice, especially where facility operations and maintenance are
concerned.
Quoting
Department of Energy stats, Flex
Your Power, California’s
statewide energy efficiency partnership of utilities, businesses,
government agencies and other entities, states that the commercial
building sector uses approximately 66 percent of all electrical energy
consumed in the United States. From 1989 to 2005, for example,
consumption of electricity doubled, a trend that, if sustained, will
likely see another 150 percent increase by 2030. Consuming roughly 23
million Megawatt-hours (MWh) of electricity, office buildings
themselves account for almost 30 percent of all commercial energy
demand. With energy representing some 30 percent of a building’s total
operating costs [1], electrical consumption by end-use category may be
extrapolated according to the break out shown in Figure 1.
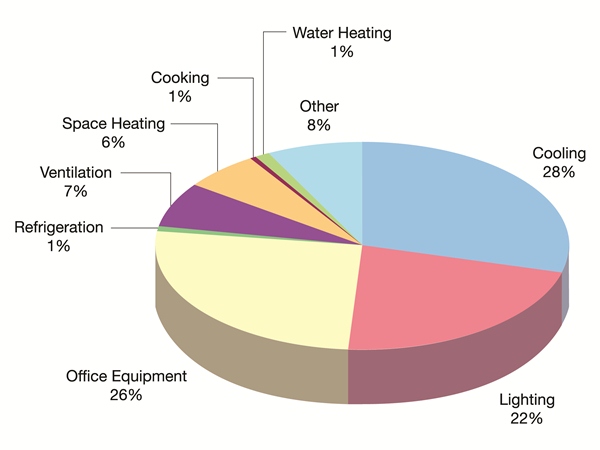
Figure 1. Commercial building electrical
consumption by using source,
based on data from a DOE 1999 end-use consumption survey. Notice that
lighting and cooling alone account for 50% of all consumption, and the
significant impact of plug load on facility demand.
Needless
to say, the pervasive use of electronically powered technology
across the facility landscape has placed unprecedented demand on the
electrical grid. In many cases, however, the energy is wasted through
inefficient equipment operation, avoidable demand peaks and other
facility operational issues that are relatively easily and
inexpensively mitigated through proper operations and maintenance
procedures. In fact, it is estimated that a 30 percent reduction in
energy use can lower operating costs by up to $25,000 per year for
every 50,000 square feet of office space. Moreover, in terms of
commercial asset value, this translates to every dollar applied toward
increasing energy efficiency resulting in a three-to-one return
[1].
As
shown in Figure 1, lighting and the HVAC/R load represent 64 percent
of the facility’s energy consumption and a great opportunity for
energy-efficiency monitoring. Typical electrical and electronic devices
suitable for operations and maintenance programs include:
•
Boilers and steam traps;
• Chillers and cooling towers;
• Energy management and building automation systems;
• Air compressors and air handling systems;
• Fans, pumps and motors;
• Lighting systems.
Typical Maintenance Strategies
There
is much more to a proper and effective facility O&M strategy
than simply repairing equipment after it breaks. Several different
types of maintenance strategies may be employed concurrently by the
facility to optimize system operation, reduce downtime and minimize
disrepair. Since every facility is unique to its own operational needs,
the following strategies may be combined in some measure to maximize
system life-cycle effectiveness and cost-effective operation. Note that
the Dept of
Energy expresses relative costs in terms of dollars per horsepower per
year [2]:
[an error occurred while processing this directive]Reactive—“run
it until it breaks” offers the advantages of less staff
required and a low cost of on-going maintenance, but can result in
unplanned equipment downtime, increased cost for equipment repair or
replacement, possible downstream equipment/process damage and others.
At $18/horsepower/year, reactive is the most expensive strategy
according to DOE (FEMP) statistics.
Preventive—equipment
failure is avoided by regularly scheduled
maintenance which provides the advantages of greater
cost-effectiveness, flexibility, increased equipment lifespan and lower
failure rates. Disadvantages include the continued potential for
catastrophic failure, labor intensity, waste due to unneeded
maintenance and others. At 12-18% cost savings versus reactive,
preventive strategies typically cost around $13/horsepower/year.
Predictive—condition-based
strategy that examines the current status of
the equipment before determining what, if any, maintenance is required.
Advantages include a 10x return on investment, 25-30% lower maintenance
costs, 70-75% fewer breakdowns, 35-45% lower downtime and 20-25% higher
productivity, according to DOE figures. The downside includes higher
investment in diagnostic equipment and staff training, and harder to
quantify savings potential. At $9/horsepower/year, predictive results
in an 8-12% cost savings over preventive strategies and a 30-40%
savings over reactive.
Reliability-centered
(Table 1)—employs many of the same practices as
predictive but takes into account that all equipment is not of equal
value nor does it offer the same probability of failure. Less important
equipment might be relegated to a reactive or preventive strategy. At a
typical cost of $6/horsepower/year, the advantages and disadvantages of
RCM are similar to predictive, but the former more closely matches
facility resources to needs while decreasing costs even further.
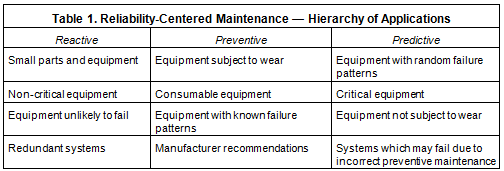
Table 1. Reliability-centered maintenance (RCM)
incorporates elements
of other strategies, based on relative importance or value of the
equipment in question. Meters are ideal, low-cost data acquisition
tools for characterizing these loads. Source: FEMP “O&M Best
Practices Guide,” P. 5.6.
Metering Approaches Useful in Facility
O&M Programs
Whichever
maintenance strategy combinations are employed by the
facility, the usefulness and value of metering is beyond question,
particularly in profiling the high-usage loads broken out in Figure 1.
When properly used, that information can lead to dramatic economic
savings of 20 percent or more by allowing facilities managers to:
•
Chart energy usage;
• Compare energy usage by day, week, month or year;
• Monitor all utility services, including
electricity, gas, water and steam;
• Schedule energy data collections to occur
automatically;
• Evaluate, in real-time, the impact of critical
load-shedding activities;
• Determine specific processes that are not
energy-efficient;
• Identify poor equipment performers by benchmarking
energy levels at multiple facilities.
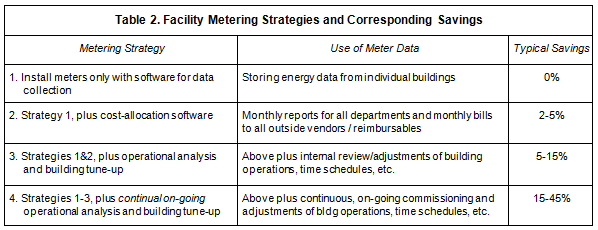
Table 2. A number of effective metering
strategies may be implemented
by the O&M program to achieve a sliding scale of savings based on
the hardware and software systems employed. Source: FEMP Fact Sheet,
January 2005 [3].
Once meters are installed and commissioned, they may be employed in a
variety of ways (Table 2), depending on the application, to control
costs, diagnose equipment problems, allocate usage costs, set resource
efficiency goals and any number of other uses.
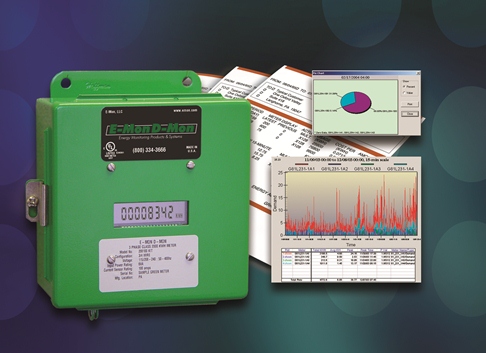
Figure 2. Advanced submeters like E-Mon’s Green Class
series [4]
provide a scrolling LCD display of CO2 emissions, kWh and other
sophisticated energy measurements that can help users gain green
facility certification points under the LEED rating system.
Essentials of Submeter Operation
Submeter
manufacturers have responded to the “green challenge” by
developing next-generation hardware and software tools that
specifically address the measurement and verification (M&V) needs
of LEED v3 and other green building energy initiatives dominating the
sustainable facility market. Certified to ANSI C12.1 & C12.16
national accuracy standards, advanced submeters (Figure 2) typically
offer a number of important functions for new construction or retrofit
applications, including:
•
Scrolling LCD display of kilowatt-hour (kWh) usage;
• kWh in dollars;
• Current demand load (kW);
• Cost per hour, based on current load;
• Estimated CO2 emissions in pounds, based on DoE
standards;
• Estimated hourly CO2 emissions based on current
load;
• Net metering, including utility-delivered vs.
user-received power and net usage;
• Compatibility with BACnet, LonWorks, Modbus,
Ethernet, RF and other popular building automation system
communications;
• Integration with automatic meter reading (AMR)
systems for billing and analysis;
• View energy usage and carbon footprint data via
easy-to-understand dashboards accessible from standard web browsers;
• Compatibility with water, gas, steam, BTU and other
pulse-output utility meters. (Figure 3)
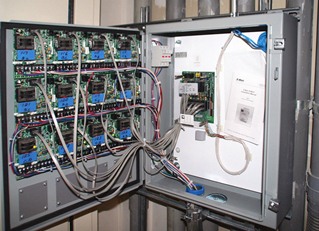
Figure 3. Whether designed in or
retrofitted, submeters are installed
on the “building side” of the main utility meter to measure energy
usage from the enterprise level all the way down to a single device or
circuit. Sold through distribution, today’s submeters are easily
interfaced with water, gas and other pulse-output utility meters to
provide a total facility energy snapshot.
Meter Dashboards Simplify Energy
Data Presentment
Internet-enabled
energy monitoring and data presentment dashboards [5]
are gaining traction in the facility environment for displaying kWh,
kW, peak demand, power factor and other energy measurements in real
time, and historically, while also displaying the facility’s “carbon
footprint.” This allows facility occupants to monitor their building’s
carbon dioxide (CO2), sulfur dioxide (SO2) and nitrous oxide (NOx)
emissions—while at the same time observing estimated energy
conservation measures needed to compensate for the displayed levels.
Figures 4-6 illustrate the sheer depth of energy information provided
by a single electric submeter.
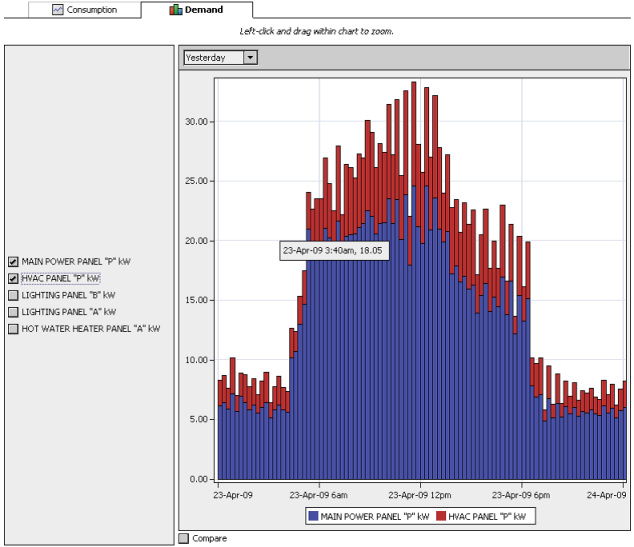
Figure 4. Demand (kW) dashboard displays
the metered values of main
power panel “P” (blue) and an HVAC panel (red) in terms of coincidental
demand for both meters. The compare button at the bottom of the screen
displays another chart comparing the same set of meters for a different
time range.
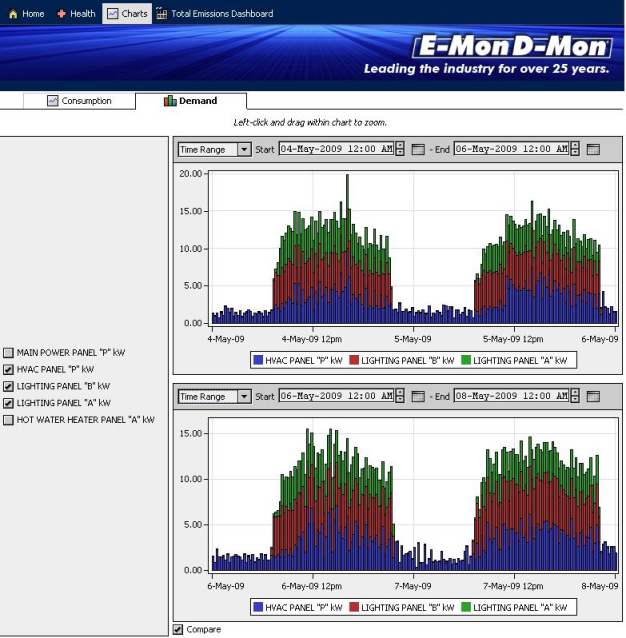
Figure 5. Comparative demand (kW)
dashboard displays the metered values
of an HVAC panel (blue) and two lighting panels (red, green).
When selected, the compare button at the bottom of the screen displays
dual charts comparing the same set of meters at different time
ranges.
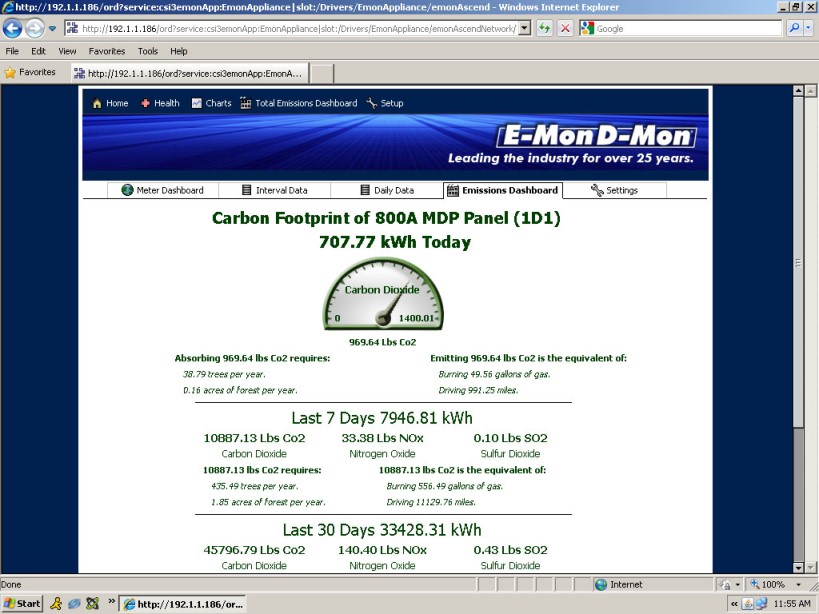
Figure 6. This carbon footprint dashboard
displays the real-time and
historical environmental impact of a specific meter based on
consumption (kWh). The main power panel “P” in this example is
characterized in terms of kWh today; number of trees and forest acres
required to absorb the CO2 in one year; and an extrapolation of
equivalent gallons of fuel consumed and miles driven. The CO2 dial at
top displays the equivalent emissions for the day, with the maximum
being the highest recorded level.
The Bottom Line is Always the
Bottom Line
The
type of sophisticated energy data needed to manage today’s
commercial and institutional facilities is beyond the capability of the
master utility meter to provide. As first-level data gathering tools in
the facility load-profiling process, submeters provide high-accuracy
15- or 30-minute snapshots of energy use (kWh) and demand (kW)—at the
enterprise level all the way down to a specific circuit or item of
equipment. Submeters are an easily installed, versatile and scalable
solution for obtaining the degree of energy intelligence granularity
needed to optimize today’s facility operations—no matter what type of
facility is being monitored.
From an
Operations and Maintenance perspective, meters help identify
operational inefficiencies, including revealing trends that may
indicate future problems. Demand spikes are also identified, allowing
facilities professionals to reschedule high-energy drawing loads to
off-peak times or stagger their duty cycles to lower the facility’s
demand profile. Considering the many uses of metering in the O&M
sphere, it doesn’t take too many “saved the day” scenarios for the
metering technology to more than pay for its own installation
costs.
About the Author
Don Millstein is President and CEO of Langhorne, PA-based E-Mon. As a
veteran energy industry speaker and author, Don is a former participant
in utility deregulation in California, New Jersey, New York and
Pennsylvania. He is a member of the FEMP task force, Alliance to Save
Energy, the U.S. Green Building Council and other energy
conservation-related organizations. He may be contacted at 800-334-3666
or dmillstein@emon.com
Sources and Links
[1] Flex Your Power “Best Practices Guide for Commercial Office
Buildings.”
Link: http://www.fypower.org/bpg/index.html?b=offices
[2] FEMP “O&M Best Practices: A Guide to Achieving Operational
Efficiency,” release 3.0 August 2010.
Link: http://www1.eere.energy.gov/femp/pdfs/omguide_complete.pdf
[3] Federal Energy Management Program Fact Sheet: “Facility Metering
for Improved Operations, Maintenance, and Efficiency,” January 2005.
Link: http://www1.eere.energy.gov/femp/pdfs/om_metering.pdf
[4] Green Class advanced submeter with CO2 carbon footprint data: http://www.emon.com/products_greenclass.html
[5] Web-Mon Internet-enabled energy monitoring dashboard: http://www.emon.com/products_webmon.html
footer
[an error occurred while processing this directive]
[Click Banner To Learn More]
[Home Page] [The
Automator] [About] [Subscribe
] [Contact
Us]