


|
April 2012 |
Babel Buster Network Gateways: Big Features. Small Price. |
|
Energy Data Anywhere, Anytime
Building data is more visual and more accessible. |
| Articles |
| Interviews |
| Releases |
| New Products |
| Reviews |
|
|
| Editorial |
| Events |
| Sponsors |
| Site Search |
| Newsletters |
|
|
| Archives |
| Past Issues |
| Home |
| Editors |
| eDucation |
|
|
| Training |
| Links |
| Software |
| Subscribe |
| |
In an article this winter, I shared how energy dashboards and
energy visualization in general have continued to evolve thanks to
technology advancements. Energy data continues to become more
visual, and more importantly, more accessible.
It’s clear that organizations realize they need to review building
performance data at a facility level, as well as engage occupants to
participate in energy reduction strategies. We heard quite a buzz
at the AHR Expo about various ways to access building performance data
and key performance indicators. If you’re attending the
Niagara Summit in April, you can catch QA Graphics help present
“Visualization, Can you Afford to Without it?” We’ll be presenting as
part of a panel, along with Ken Sinclair, to discuss the latest trends
and provide a look at some of the latest visualization tools and how
they are being used across the industry.
This is a topic we’re happy to continue to provide insight on, along
with the new technologies we continue to introduce to the
industry. One thing we’re excited to introduce at the Niagara
Summit, which we anticipate to be an industry changer, is the release
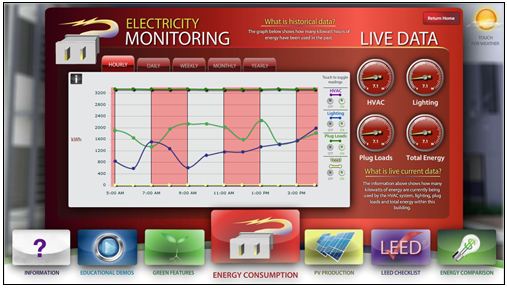
of version 3.0 of our Data Manager. The Data Manager is an integral
component of the Energy Efficiency Education Dashboard®. Now it’s
capable of gathering real-time data from multiple buildings across
multiple locations, allowing organizations to educate on their key
performance indicators anywhere, anytime.
Version 3.0 was developed in the .NET Framework, evolving the
“traditional” energy dashboard solution to a platform. This offers a
much more collaborative environment with limitless connectivity.
The solution runs leaner and can handle mass amounts of data from an
unlimited number of buildings across multiple locations. It’s
almost limitless as to how many data points can be accessed. Now,
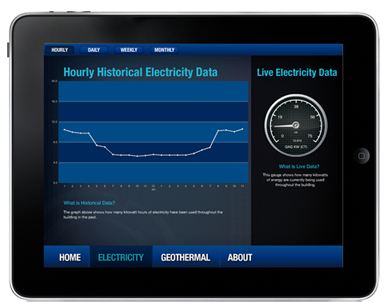
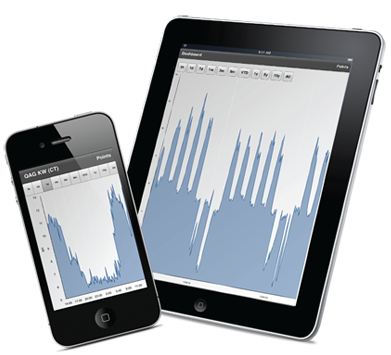
the building performance feedback can be displayed anywhere, anytime -
deployed via touchscreens or kiosks onsite, on the web, and on mobile
devices including Apple iOS (iPhone, iPad, iPod touch), Android and
BlackBerry.
The solution remains open-protocol and supplements the existing BAS or
meters. The data’s already being generated, so it’s just up to you to
determine how you leverage that data; whether it’s for fast access to
key performance indicators, or using the data to educate
occupants. The interactive solution can be used to further engage
occupants and allow them to interact with the energy data and other
educational features. Organizations can incorporate the solution
as part of an ongoing strategy to help occupants understand and reduce
energy usage. With this energy efficiency information available on the
go, occupants can access the data on their mobile device at their
convenience. These enhancements also provide a great opportunity
for large-scale energy competitions, social communication and cloud
managed data.
Energy competitions have been common among universities, engaging
students in a fun rivalry to save energy. Now, with these
technology advancements, organizations of any type can initiate their
own competition. For example, hospitals or a group of healthcare
systems located all over the country could compete amongst one another.
Each physical location can install a gateway device or write a web
service to push the data from their building automation system/or
meters to the Data Manager. Then the data is available in the cloud for
everyone to access. With a competition like this, the traditional
concept of displaying a dashboard in a building common area can easily
be bypassed. All of the data can be accessed from the cloud, and
deployed on the web or mobile devices for everyone to access on the go
– anywhere, anytime.
With new technology like this and other advancements in the industry,
you can access energy data on your terms – anywhere, anytime. It’s
really limitless to how this information can be shared and displayed. How do you plan to use it to your advantage?
See for yourself how energy data can be accessed on the go:
Download the iPad app, “QAG EEED”. This app provides real-time
feedback from QA Graphics’ office building:
http://itunes.apple.com/us/app/qag-eeed/id505582700?mt=8.
This is an example that provides fast access to data for multiple
buildings. Download the iPhone app “MEED” at:
http://itunes.apple.com/us/app/meed/id499679547?mt=8.
About QA Graphics
QA Graphics works with organizations of all types throughout North
America providing their solution, the Energy Efficiency Education
Dashboard, to help educate and inform occupants about building
efficiency. To learn more about how technology continues to improve how
we visualize and interact with energy data, visit www.qagraphics.com/eeed.

[Click Banner To Learn More]
[Home Page] [The Automator] [About] [Subscribe ] [Contact Us]