|
December 2010
Article
AutomatedBuildings.com
|
[an error occurred while processing this directive]
(Click
Message to Learn More)
|
|
Dashboards for Buildings
Dashboards are meant to convey essential information quickly and
clearly on one screen.
|
|
“The question is not what you look at, but what you see.” Henry David Thoreau
Overview
Building systems can provide a lot of data through BAS points,
sensors, meters, databases and measurements with a subset of that data
being the foundation for energy management. However, lots of data does
not necessarily mean lots of actionable information. Data is “raw”
material and its real value is being transformed into useful
information where some intelligence has been gleaned from analyzing or
studying the raw product. The final link in this chain, and probably
the most important, is the user interface (UI) or the human-machine
interface (HMI), where the actionable information is presented to the
person who will act upon the information. For years the user interface
was the typical BAS graphics, which generally looked like something
designed in the 1980s. Today the more advanced integrated building
management systems use the increasingly popular browser-based
dashboards to present information to users.
What follows are some tips and guidelines on creating dashboards for
facility and energy management covering what information is needed, how
that information should be presented to a user, and a couple of
industry examples.
What to Present
[an error occurred while processing this directive]
Dashboards can provide relevant and timely information to
several organizational levels or groups involved with a building’s
performance. These different users can be facility technicians,
managers, C-level executives and even tenants, occupants or visitors
through kiosks or a web page. The information provided may cover the
specifics of particular building systems such as HVAC, electrical or
specialty systems, but they tend to focus on energy usage, costs, KPIs,
trends, alarm management, comparisons with similar buildings or
building uses, etc. So the first and probably the most important steps
are determining the right information for the intended viewer of the
dashboard.
Facility technicians have different information needs than C-level
executives or the general public. For example, a facility engineer may
be interested in subsystem alarms and alarm management. In this case
the dashboard needs to display alarm priority, escalation status, alarm
acknowledgment, repetitive alarms, “out-of-service” alarms and
sub-system communications or component failure, etc. C-level
executives, such as Directors of Facilities, Sustainability or
Procurement may want information on energy usage and cost. In this case
the dashboard should display the usage and costs of a building’s
comprehensive and individual utilities, budgeted versus actual utility
costs, budget deviations, comparisons with other similar buildings,
meter output for alternative energy sources such as photovoltaic and
wind energy, etc.
In developing a series of dashboards, you need to identify what
decisions or insight each user or group hopes to gain by using the
dashboard and what information at what time interval is needed to
support their decision process.
Dashboards will be fed from data and that data will probably need to be
collected from several sources: building automation systems, specialty
systems, business systems, etc. For example, if it’s an energy
dashboard you’re creating, energy usage may be generated in a BAS,
whereas the cost of the energy may be in a database in the company’s
accounts payable system. If you’re a healthcare organization you may be
interested in metrics such as energy use of an MRI machine per patient
and need patient counts from business systems; or, if you are a retail
company it may be energy use per customer or per sale and you need
customer and sale data from the business systems.
To gather all the information needed for a dashboard you may need a
middleware platform to normalize and standardize data generated from
several sources in possibly different database formats. This would
allow a flexible and consistent platform for the dashboard but also
could potentially trigger additional data management with large amounts
of data. Dashboards in general are typically used for high-level
performance summaries with some dashboards such as analytical
dashboards needing to “drill down” to specific data, so data management
can depend on the specific use of the dashboards.
How to present the information
Dashboards are meant to convey essential information quickly and
clearly on one screen. Most importantly they do so based on their
visual design. Visual design is much more than nice graphs and
spreadsheets. It involves how human beings perceive and act upon visual
information, a science in the realm of “human factors” and “cognitive
psychology”. Although this may sound like you’ll need a PhD to
understand it, it actually is somewhat intuitive.
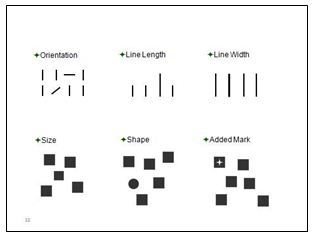
It all starts with something known as “pre-attentive variables”;
these are the attributes of the dashboard that humans subconsciously
pay attention to before they consciously know they are paying
attention; thus pre-attentive attributes. This innate perceptual and
cognitive capacity to pay attention unconsciously evolved in human
centuries ago. So if you’re designing a dashboard to quickly display
information, you take into account the pre-attentive variables to
essentially get the user’s attention before they know they’re paying
attention. Here are a couple of the major pre-attentive variables:
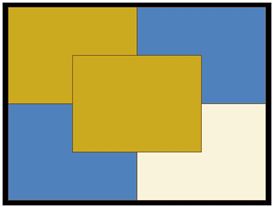 The position of the information on the dashboard
Information can be emphasized or de-emphasized by its position on a
display. The visual dominance is the center of the screen (gold).
Depending on the culture and how the culture reads (left to right, or
right to left) the other area of dominance will either be the top left
or top right of the screen. The other corners are neutral (blue), or in
the case of the bottom right, actually de-emphasized. So the most
important data, such as key performance indicators, has to go in the
center or the top left of the dashboard – this is especially true if
other data on the dashboard can only be understood after an
understanding of the most important information.
Color
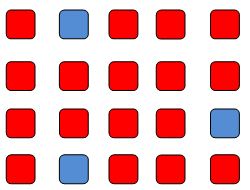 Color is another pre-attentive variable that can aid in the clarity and
quickness of understanding information. Here’s an example of how easy
it is to pick out data based on the blue color. In fact, if there were
many more data points, the time to scan and quickly pick out the blue
data points would be about the same.
Color is another pre-attentive variable that can aid in the clarity and
quickness of understanding information. Here’s an example of how easy
it is to pick out data based on the blue color. In fact, if there were
many more data points, the time to scan and quickly pick out the blue
data points would be about the same.
Our perception of color is relative and dependent on the color or
context that surrounds the colored object, so selecting the color of
the object and a contrasting and consistent color for the background is
important. There are variations of the use of color as a pre-attentive
means, such as color hues, brightness and color saturation.
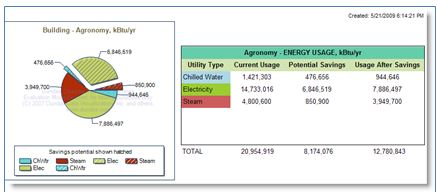
 Shapes and Sizes
Shapes are also a pre-attentive variable that like color can assist the
user in quickly differentiating data sets. The size of a shape may be
used to convey quantities or magnitude. Enclosing a set of data in a
border or using icons to provide meaning or draw attention are also
positive uses of forms and shapes.
The reason pre-attentive attributes are important is simple. Dashboards
should quickly and almost instantly allow the viewer to grasp the
information important to the user. Pre-attentive features are just a
head-start on that process, providing information to the viewer before
the viewer consciously knows he or she is paying attention.
Industry Examples
Here are a few industry examples of well –executed building and energy dashboards:
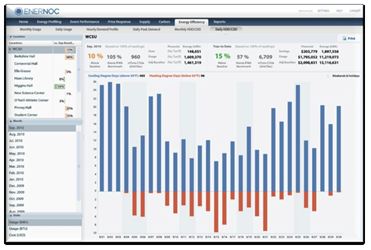
This is an Enernoc dashboard. It’s one of several screens, with the
most important information in the most-emphasized screen position.
Viewers can also interact with the dashboard to calculate and change
timelines.
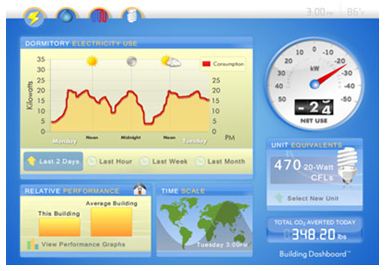
Lucid Design is best known for their work in higher education and this
dashboard addresses electrical use in a dormitory.
Note the
positioning, the colors, the user options and the clarity.
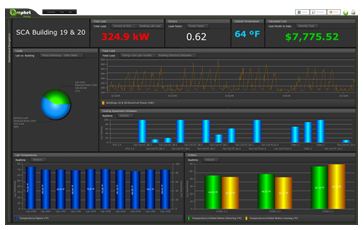
This is a dashboard for Prophet Suite, developed by Controlco and DG
Logik that provides a building overview.
This is a great use of color
with the presentation of all vital information; temperature, loads,
costs, labs versus building, cooling and electrical, etc..
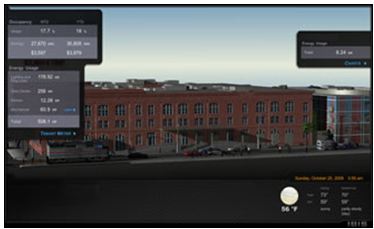
Part of the IBS Intelligent Building Interface System (IBIS®), this
module provides you with real-time data and LEED Point information
based on Power (Gas and Water optional) Metering sources as well as
pre-selected key performance indicators for your Enterprise, Site,
Buildings, Systems and Equipment. 3D is optional.
Sensus MI utilizes its EnergyWitness to benchmark each building’s
performance against an established benchmark.
Users can compare
more operating parameters such as weather independent base load or set
energy consumption goals and benchmark other buildings in the portfolio
against it.
Of course, there are many more dashboards to consider. Dashboards
are the end result of a lot of work that has to take place to identify,
gather and standardize data and to clearly understand the roles and the
needs of people involved with facilities and energy. If they succeed in
providing actionable information in a timely fashion, dashboards have a
positive effect on managing a building’s performance and operation.
For more information, write us at info@smart-buildings.com
footer
[an error occurred while processing this directive]
[Click Banner To Learn More]
[Home Page] [The
Automator] [About] [Subscribe
] [Contact
Us]