|
December 2011
Article
AutomatedBuildings.com
|
[an error occurred while processing this directive]
(Click
Message to Learn More)
|
|
The Importance of Building Automation Systems
Visualization
Through
flexible and intelligent
building automation visualization, disparate systems, which would
otherwise be an obscured asset, can be easily and quickly comprehended.
|
|
Building
system data is an asset for any company. Every building is
unique and energy consumption within all buildings varies and
fluctuates, which should be managed in a unique manner. To be as lean
as possible and maximize efficiency, this requires an intelligent
Building Automation System (BAS) and a customizable graphic user
interface (GUI) for unique dashboard creation to accurately visualize
this information. Effective BAS visualization enables faster energy
analysis, monitoring, and the ability to “tell the story” of the
building performance to management, engineering, building operators and
executives alike to make better decisions on ways to troubleshoot
potential problems and cut costs.
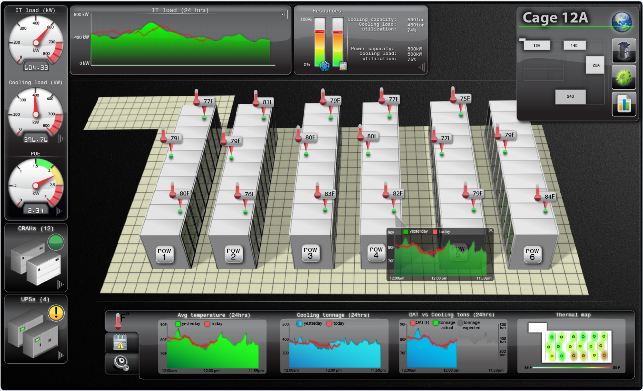
As an industry, the importance of specific, real time data mining is
clear but what good is the information if you can’t clearly comprehend
it? Visualizing real time data using cutting-edge graphics enables
faster digestion and quicker utilization. Your information is only as
valuable as your presentation. Through flexible and intelligent
building automation visualization, disparate systems, which would
otherwise be an obscured asset, can be easily and quickly comprehended.
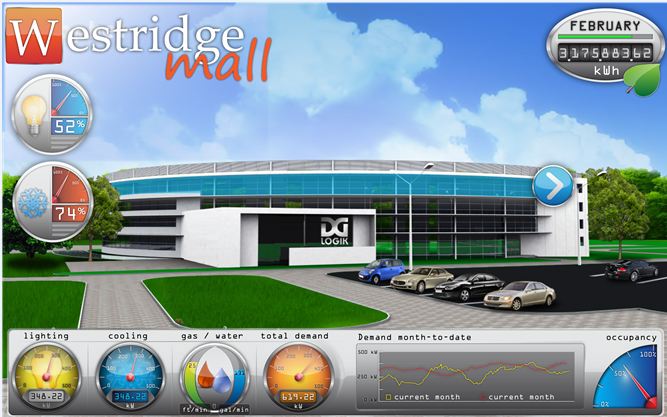
Building automation needs a visual interface like an automobile needs a
dashboard. Although your building automation system may be running,
without visualization you will never be able to monitor how fast you
are burning energy or have the ability to change your energy
consumption. Companies without the technology to visualize buildings
system data will never be able to fully understand the
amount of energy
they could save and costs they could eliminate. For example,
scientists at a federal laboratory reported to the New York Times in
2009 that if power plants and infrastructure were to monitor electrical
use over a 20-year period they would save $70 billion and avoid the
need to build the equivalent of 30 large coal fire plants.
Additionally, if households were to have the same digital tools to set
temperature and price preferences, the peak loads on utility grids
could be trimmed by up to 15% per year.

Companies understand the advantages of
being Leadership in Energy and
Environmental Design (LEED) certified. In a sustainable world, you want
to be as green as possible, not only to help the environment, but to
keep up with the Jones’. With clearly organized visualization, it is
much easier for companies to showcase the internal buildings systems
data and for outsiders to accept. The current technology platform even
includes a macro to micro, Google Maps inspired, visualization.
Visualizing to an outsider a corporate portfolio of building’s
electrical output down to an exact light bulb in a single hallway in
real time with a few clicks shows how advanced we have come in
comparison to the relatively unorganized history logs of the past. If
companies continue to live in the past, they will only continue to lose
out on the asset of fully utilizing building systems data to the
fullest. Accept the fact that there is a better visualization platform
for building systems data visualization. Refuse to waste any more time,
money, or energy. The technology to have all of your building
performance data visualized and contextualized is available. Upgrade
your building automation system user interface, start managing more
efficiently and cutting costs now.

footer
[an error occurred while processing this directive]
[Click Banner To Learn More]
[Home Page] [The
Automator] [About] [Subscribe
] [Contact
Us]