Data analytics go beyond Fault detection analytics to address a range of financial and organizational needs.

John Petze
Partner and Co-Founder
SkyFoundry
|
December 2019 |
[an error occurred while processing this directive] |
| Data
Analytics Is About More than FDD Data analytics go beyond Fault detection analytics to address a range of financial and organizational needs. |
John Petze Partner and Co-Founder SkyFoundry |
| Articles |
| Interviews |
| Releases |
| New Products |
| Reviews |
| [an error occurred while processing this directive] |
| Editorial |
| Events |
| Sponsors |
| Site Search |
| Newsletters |
| [an error occurred while processing this directive] |
| Archives |
| Past Issues |
| Home |
| Editors |
| eDucation |
| [an error occurred while processing this directive] |
| Training |
| Links |
| Software |
| Subscribe |
| [an error occurred while processing this directive] |
In our fast-paced
world, we often look for simple definitions of new technologies.
Mention the term “analytics,” and many people will immediately think –
“Fault Detection – analytics is used to detect faulty operation of
equipment systems.” While FDD is an important use of analytics, it’s
not the only one. Organizations that embrace the full capabilities of
true data analytics are able to address a range of financial and
organizational needs faced in operating and maintaining facilities and
equipment systems and move to data-driven facility management.
Automatically
Tracking and Reporting Key Performance Indicators – KPI’s
Data means different things to different people
in an organization.
Managers responsible for tracking and ensuring operational performance
and meeting financial goals need to be able to quickly and easily see
key performance indicators and their trends over time. Analytics
provides continuous calculation of KPI’s and presentation of KPI’s data
in a range of formats and report types. Examples of common KPI’s
include:
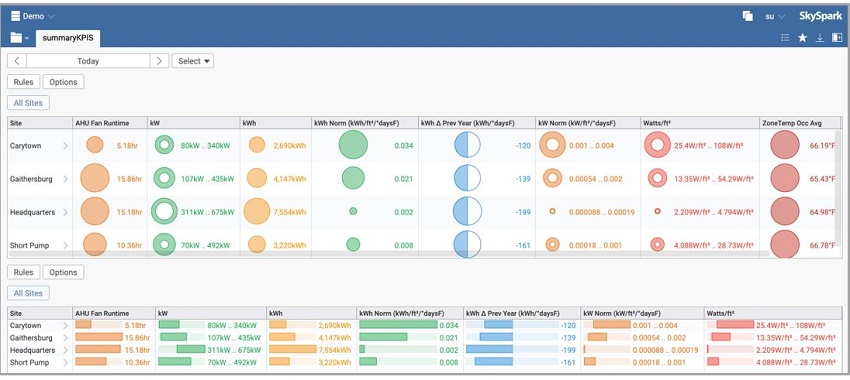
Image
showing typical KPI’s visualized as bubble charts and bar charts
Energy
Analysis and Reporting
Energy data is commonly used with analytics
software. The key to
creating value, though is what you can do with it.
One common challenge is that energy data comes from many different
sources and is stored in many different locations and formats. For
example, you might have a smart meter provided by the utility,
submeters connected to a Building Automation System, or years of
historical energy data stored in files, along with tariff rate
information on hardcopy paper. Once all of this energy data is brought
together in a unified format, operators can easily view, compare and
analyze energy performance, no matter what the original source or
format of the data was.
Typical benefits include:
And, on the subject of reporting, many operators
get benefit from
automatically posting energy data to Energy Star Portfolio Manager,
eliminating hours of manual effort that is required to meet regulations
for energy reporting in many jurisdictions.
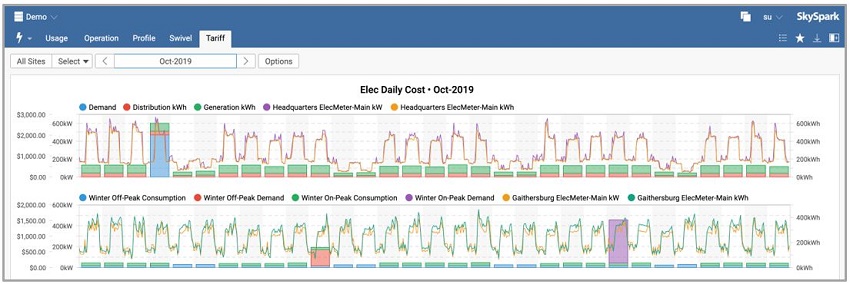
Image showing correlation of energy consumption and demand (line
charts) with
tariff-based cost calculations (bar charts)
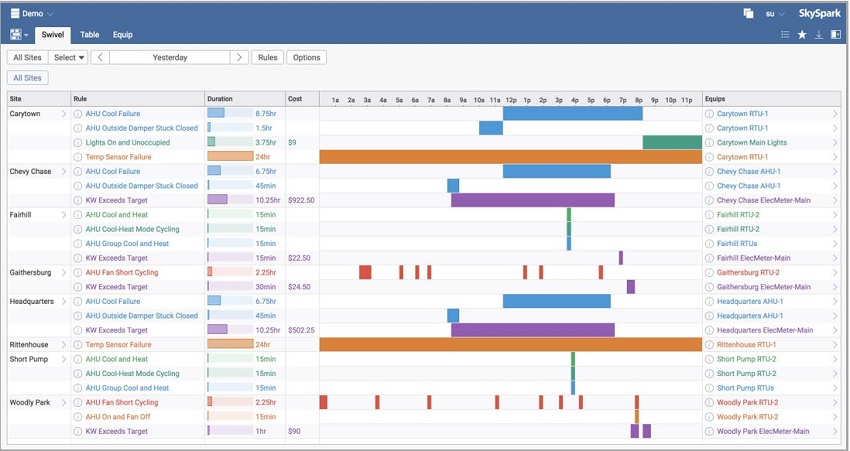
Confirming and Reporting Proper Operation
Analytics isn’t just used to find things that are wrong. An important
application of analytics is to confirm that systems are operating as
expected, investments are achieving expected results, and reporting
that information to the appropriate users in formats that meet their
needs. Reporting could require export of analytic results and KPI’s in
a neutral format like Microsoft® Excel™, or automatically delivering
formatted PDF documents that include informative graphics, charts,
views presenting summaries of performance KPI’s and analytic results.
Confirmation can take the form of simple reports that show KPIs and
performance trends or can go to a more detailed level of full
Monitoring & Verification using IPMVP processes and protocols. This
document provides a detailed overview of the IPMVP and shows how
analytic tools can be applied to meet those requirements:
https://skyfoundry.com/file/337/Applying-SkySpark-for-MV-Using-the-Intl-Performance-MV-Protocol.pdf
Justifying Expenditures
[an error occurred while processing this directive]
One of the significant benefits facility managers realize from
utilizing analytics is the ability to evaluate better to justify
expenditure – both capital and operating. The key to achieving this
goal is the ability to automatically calculate operating costs and the
impact of detected issues AND creating reports that put that
information into a format that speaks to financial analysts and
managers. Bridging the gap in understanding between operations and
financial staff is a key benefit provided by analytics.
Automated System Optimization (ASO)
The most advanced analytics solutions on the market provide two-way
communication with control systems to modify setpoints and other
operating parameters in response to analytic results in a concept known
as enabling Automated System Optimization. Analytics software provides
far deeper insights into performance and system operation than possible
with typical control systems.
Meeting All of These Needs
To meet the requirements of these widely varying applications, you need
analytics software that provides complete flexibility. You need to be
able to work with multi-structured and semi-structured data in all
different formats.
You need to be able to communicate with external systems to acquire
data, whether its live data from control systems, meters, sensors, IoT
devices, or provided via a web service or file-based data stored in
another application or database.
And you need the ability to write analytic rules, functions and
algorithms and define KPI calculations to meet the needs of your
specific application – that means a fully programmable solution
combining user programmability along with an extensive library of
analytic functions from ready-to-go analytic rules to advanced math and
machine learning.
About the Author
John Petze is a partner and Co-Founder of SkyFoundry, developers of
SkySpark™, an analytics platform for building, energy and equipment
data. John has over 50 years of experience in building automation,
energy management and M2M, having served in senior-level positions for
manufacturers of hardware and software products, including Tridium,
Andover Controls, and Cisco Systems. At SkyFoundry he is working to
bring the next generation of information analytics to the “Internet of
Things.”
More information on SkySpark® analytics is available at
www.skyfoundry.com
[an error occurred while processing this directive]
[Click Banner To Learn More]
[Home Page] [The Automator] [About] [Subscribe ] [Contact Us]