 US Energy Markets – New Models Leighton Wolffe
|
February 2019 |
[an error occurred while processing this directive] |
|
Utility Rates & Tariffs
Perspectives on a Changing Landscape, Business Impacts and the Role of
a Tariff Engine |
Leighton Wolffe, Northbridge Energy Partners Stephanie Fetchen, RateAcuity John Petze, SkyFoundry |
| Articles |
| Interviews |
| Releases |
| New Products |
| Reviews |
| [an error occurred while processing this directive] |
| Editorial |
| Events |
| Sponsors |
| Site Search |
| Newsletters |
| [an error occurred while processing this directive] |
| Archives |
| Past Issues |
| Home |
| Editors |
| eDucation |
| [an error occurred while processing this directive] |
| Training |
| Links |
| Software |
| Subscribe |
| [an error occurred while processing this directive] |
In this article, we combine the expertise of three industry professionals to acquaint the reader with an understanding of Power Markets, Utility Rate Programs, Tariff-based Energy costs and their relationship to analytics, controls and energy management strategies.
Leighton Wolffe, of Northbridge Energy Partners, will start the discussion by providing an overview of the rapidly evolving with national, regional and local power markets and how legislative, regulatory and energy policy changes, as well as emerging renewable energy resources such as solar, wind, storage, along with weather and consumer demand, create increasingly complex scenarios of supply, pricing, and risk. These factors drive the costs of electricity in complex ways, impacting the opportunities for analytics and control technologies. Analytics need to go beyond fault detection and HVAC operations to be relevant in today’s sophisticated energy economy to provide building owners with a clear understanding of how their buildings operate in the context of market dynamics. This enables them to make informed decisions on how to buy and use energy. All of this creates business opportunities for the community.
Stephanie
Fetchen, of RateAcuity, will present examples of rate differences
and the substantial impact they can have on operating costs under the
same levels of consumption and demand. As an example in some rate
programs, operators can achieve lower overall costs by using more kWh
to help avoid kW demand peaks. The key to these types of analysis is to
combine tariff rate data with consumption and demand data. The
inclusion of detailed electric rate information in analytics enables us
to translate kWh and kW into dollars. Providing saving and/or cost
information in dollars is much more meaningful to our end users than
seeing it in kWh or kW. A tariff engine is essential to this
calculation, but you need rate data to take advantage of it. But rates
can be complex, hard to access and presented in many different formats.
Complexity in electric rates is caused by the availability of multiple
rate options, as well as varying levels of details within each rate
schedule.
John Petze, of SkyFoundry, will discuss the final step in generating value from rate and consumption data – modelling rates and utilizing a Tariff Engine to calculate true energy costs and the presentation that information to operators to enable them to make better decisions on rate selection and energy management strategies.
US Energy Markets – New Models Leighton Wolffe
US
Energy and Utility markets are rapidly evolving in accordance with
regulatory and legislative changes at the Federal, State, and Regional
levels. What had been a historically staid and slow-moving industry has
now become supercharged with the advent of renewable technologies and
distributed energy resources.
Solar,
Wind, Storage installations are becoming dominant resources to
supplement traditional generating power plants. Beyond the technology,
the introduction of these new forms of generation is responsible for
changes resulting in the decentralization of the monolithic utility
business model that has been in place for the past 100 years. Roll over
Edison.
Given
the pace of national and local activity, energy market models in place
today will not stay the same as the regulated and competitive markets
adjust to the increasing integration of grid-scale renewables. This new
mix of firm and intermittent energy resources directly impact the way
energy suppliers price power purchasing agreements and how consumers
pay for electricity originating from multiple sources.
Utilities and firm generating resources (nuclear, coal, gas, hydro)
have different costs to operate. Solar and Wind are intermittent
resources and have minimal operating costs once installed – certainly
when compared to conventional power plants. Additional costs that drive
retail energy pricing include moving electrons from the source to the
consumer with the transmission, and distribution charges being part of
every electrical bill.
The output from renewables can cost less to produce than generating
plants. With solar and wind peaking at different times in the course of
the day, oversupply can cause power prices to plunge and additionally,
power prices occasionally spike to untenable highs when demand peaks in
supply-constrained localized areas – further compounding the inequities
between supply, demand and wholesale energy prices.
Developers and utilities build new generating resources, based on
assurances they can sell the output. These origination deals have ROI’s
that are predicated on price commitments from buyers that are usually
in place before the steel goes in the ground. Suppliers with
under/oversupply can exercise options to buy and sell output on the
spot market – with attendant risks and uncertainty due to market and
pricing volatility.
Regardless, new wind and solar farms are being constructed in every
region, and as cost curves continue to decrease, the localized cost for
energy for solar has decreased by over 86%, and the wind has decreased
by 67% in just 8 years. (Lazard Research)
Case in point – the adoption of solar in California had risen from 0.5%
of total generation in 2010 to 10% in 2017. In fact, there is such a
surplus at peak sunshine periods, at times California has to shunt
power and pay other states (Arizona) to take the excess so as not to
overload the grid.
In Texas, ERCOT’s installed wind capacity has nearly doubled since
2010, leaping from 9,400 megawatts seven years ago to over 23,000 MW
today. In 2015, wind surpassed nuclear to become the grid operator’s
third-largest power source. At the end of 2017, Texas had more than
22,000 megawatts of wind power, more than triple Oklahoma’s 7,500
megawatts of wind generating capacity, the second highest in the nation.
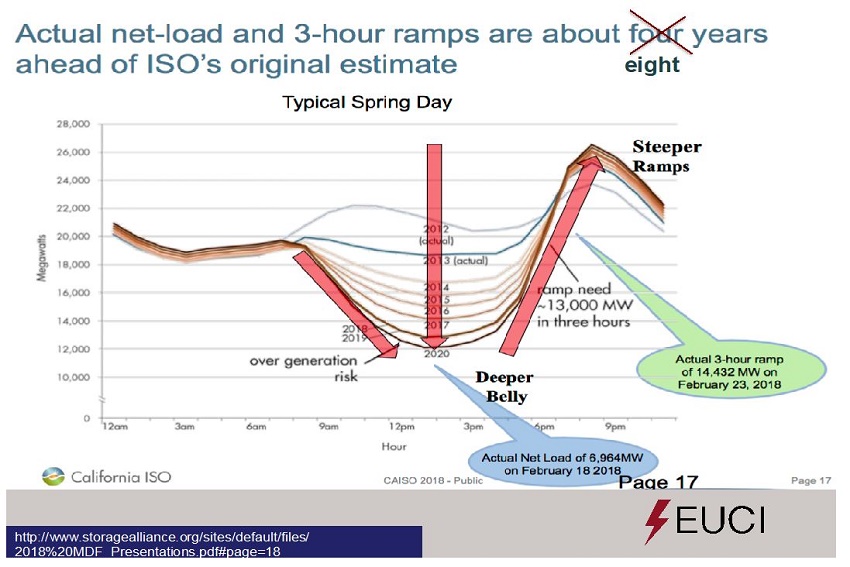
The famous California “Duck Curve” is one such example of how the
introduction of renewables is radically changing the load curves of
entire regions. Moreover, this is taking place faster than originally
forecasted, further compounding the issues for suppliers to match
output with demand.
The
rapid upswing of alternative energy is wonderful news to meet
renewable goals. Somehow though, the grid has to absorb these new
sources of energy while maintaining the delicate balance of matching
supply with demand – in real time. BUT, the sun is not always shining,
and the wind may not be blowing when consumer demand needs it. So, the
grid operators have to rely on the traditional mix of baseload
generators and peaking plants to supply power to meet all the demand
and still have some in reserve. As well, grid-level storage is
increasing as a firm resource. Demand Response has been part of
the solution, but it can only go so far shedding load before impacting
operations and tenant comfort.
These are complex issues that occur every day and every hour across the
United States electrical grid, and the solutions are not easy. So, what
happens when renewable energy is not available? Who is responsible for
all this and managing the grid? How are electricity prices determined?
Energy Market Structures
To understand the breadth of these issues, and to appreciate the
current and emerging methods used to address solutions - some
background on those managing the electrical grid:
There
are a number of agencies involved in the oversight and management
of energy markets - these include: The Federal Energy Regulatory
Commission (FERC) is the
United States federal agency that regulates
the transmission and wholesale sale of electricity and natural gas in
interstate commerce. Each state has its own Public Utilities Commission
appointed by governors to terms of varying length, but some are
elected.
The
US has regions that are either Regulated (vertically integrated
utilities) or De-regulated (competitive energy markets). Many of the
regions interoperate and share the power to ensure reliable power to
the grid and to consumers.
Traditionally regulated electricity markets exist primarily in the
Southeast, Southwest and Northwest where utilities are responsible for
system operations and management, and for providing power to retail
consumers. Utilities in these markets are frequently vertically
integrated – they own the generation, transmission and distribution
systems used to serve electricity consumers.
In the De-regulated energy markets, the independent systems operators
(ISOs & RTU’s) operate the transmission system independently of the
utilities and foster competition for electricity generation among
wholesale market participants.
Each of the ISOs and RTOs has energy and ancillary services markets in
which buyers and sellers could bid for or offer generation. The ISOs
and RTOs use real-time bid-based markets to determine economic
dispatch. While major sections of the country operate under more
traditional markets, many of the nation’s electricity load is served in
RTO regions.
US Electrical Regions:
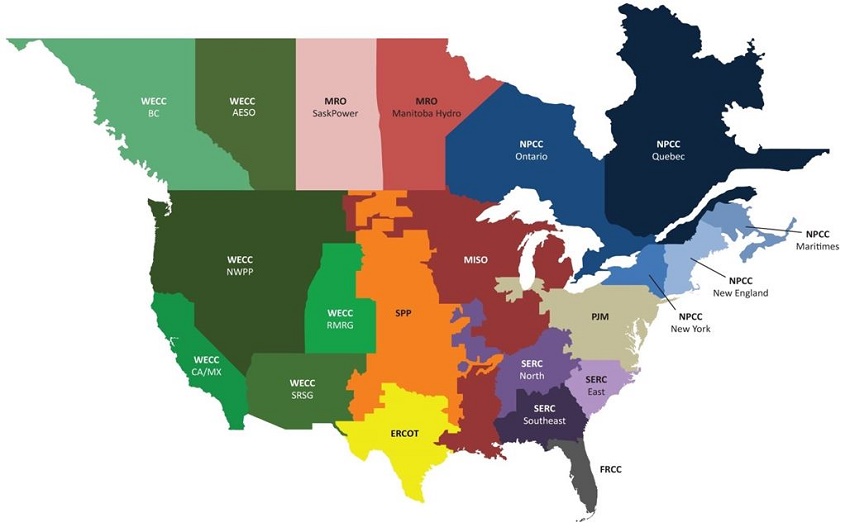
In
every market, region and zone, the grid operators have to find a way
to deliver steady power in real time. However, increased demand can
create hot spots, and additional supply resources are typically called
upon with peaking plants – often being the costliest forms of energy.
This drives the wholesale prices of electricity up – that has to be
paid for by the supplier. In order for the suppliers to cover their
costs and as an insurance hedge, power purchasing agreements include
rates, tariffs, and demand charges that (hopefully) make up the
difference more often than not. The customer sees these for every month
on their bill.
Consumers are directly exposed to these complex energy market dynamics.
In the wholesale and retail markets, there are structures in place to
manage and regulate the relationships and financial transactions
between the market participants and the consumers. While complicated,
they follow similar practices as the stock market and financial trading
operations between sellers and buyers – in this case, the commodity of
electricity. The retailer energy provider serves as the broker or
intermediary.
LMP Pricing Variations
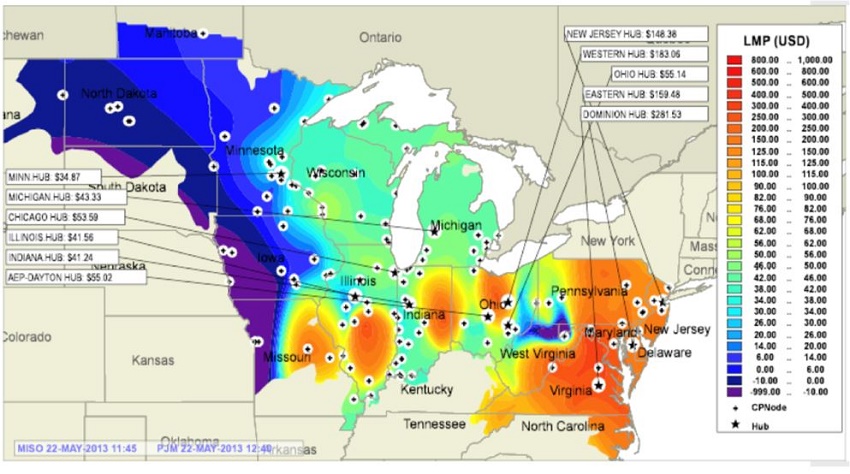
New Business Models – New Pricing Models
As the energy markets evolve, new forms of managing risk will emerge –
principally around pricing. In order for the new markets to work
effectively across the entire energy chain, consumers need to be an
active participant. This means having an awareness of market
conditions
to make business and operations decisions on when, and how to use
energy. In order to do this, consumers need to monitor their own energy
usage and operational patterns to make informed decisions to effect
beneficial changes.
Collecting and analyzing meter data is the first step. That provides
intelligence on usage at any given point in time. Historical and
real-time meter data can be collected via a number of methods and
applied to provide simple trend analysis, KPI’s, and with more
sophisticated software programs, for comparative and qualitative
analysis of large datasets where they can be especially effective to
manage portfolios across multiple power markets. The challenge,
however, is each market has its own tariffs, pricing structures, and
issues around supply and demand. There is a wealth of intelligence
contained in meter data alone, but it is only valuable if used and
applied.
The second step is to assemble data from the building automation system
(BAS) and building equipment to reveal what is happening when – that
drive energy usage. Until recently, BAS’s were not designed to offer
much more than temperature control and time clock functionalities and
were not intended to share information with other systems freely, but
now higher order analytic software programs are available from third
parties to extract BAS data, integrate with energy data and apply
sophisticated analytic tools.
The third step is to create operating strategies to manage demand in
the context of market conditions – and within the terms and conditions
of the power purchasing agreement. This is accomplished by enhancing
the customer’s ability to manage their usage that comports with
business, operational, and financial rules that are applied under
different pricing thresholds.
When these three levels of data management are in place, the customer
is ready to engage the new energy markets with confidence and with
newfound ability to leverage and negotiate improved power purchasing
agreements – because now the customer is able to self-manage risk, and
the retail energy supplier has less risk to price.
The customers that have control over their equipment to adjust their
demand are going to be the real beneficiaries of the new markets. Those
without the ability to monitor and control their buildings will
continue to operate blindly and will have to pay the price – whatever
it may be.
Dynamic pricing models are coming – depending on which regions your
buildings reside, it is either already happening – or coming your
way. For example, California's investor-owned utilities have
already rolled out default time-of-use rates to millions of customers
this year, and utilities around the country are watching closely.
Electric rates that more accurately reflect market conditions will help
utilities integrate more distributed resources, but customers have been
on fixed-rate plans for decades – so this represents changes and new
ways for customers to buy and use energy – and this all needs to be
supported by solid data to make informed decisions.
 Unlocking Real Energy
Costs with Rate Data
Unlocking Real Energy
Costs with Rate DataIntegrating
electric rates with analytics has become an important topic
in our industry in recent months. The main reason for this is simple;
integration helps our customers, the end user building owners and
facility managers, better understand electric spending within their
buildings. There are a few key benefits of integration. One
of the most useful of the benefits of including electric rates in
analytics is the ability to translate reports that are traditionally
shown in kilowatt hours or kilowatts into dollars.
Reporting
Historically,
reports showing energy usage or potential energy savings
information are presented as kWh or kW. Let’s say a building
owner knows that 17,000 kWh could be saved annually by the installation
of a high-efficiency air conditioner. That’s a good start to
knowing the potential benefits of the equipment upgrade. But what
if we could provide the building owner information about the actual
cost savings of that 17,000 kWh? It would be much more useful
information for evaluating the return on the equipment
investment.
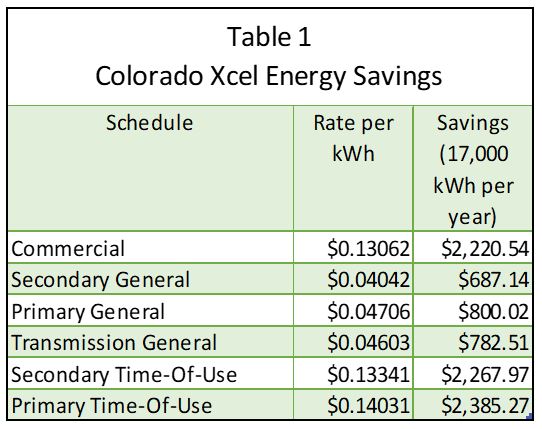
In order to determine the actual cost savings, we need to know the
utility and schedule the building is served under. For purposes
of this example, we will use a building that is in the Colorado Xcel
Energy area. As shown in Table 1, the actual annual savings for this
high-efficiency air conditioner varies significantly based on the rate
schedule the building is served under. Presenting the building owner
the savings in dollars based on the actual tariff schedule being used
by the building can help significantly with making a well-informed
decision.
Billing
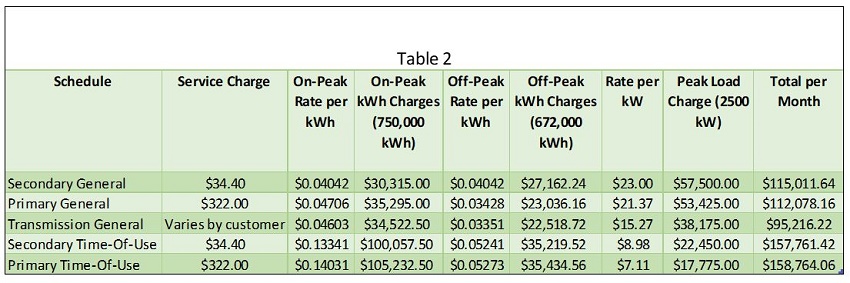
Integrating
electric rates with SkySpark can also help end users answer
billing questions. For the next example, we will look at a
facility that used 750,000 kWh of energy during the on-peak period,
672,000 kWh of energy during the off-peak period, and had a maximum
demand of 2500 kW for the month of August. Again, the facility is
in the Colorado Xcel Energy service area. Table 2 demonstrates
the charges the facility would pay based on the different rate schedule
options available. As shown in the table, the same consumption
and capacity can result in greatly varying charges based on the
schedule the facility is served under. This information can help
the facility answer questions such as would it be better served under a
different schedule, and how shifting usage patterns might benefit
building expenses. Some suggestions to reduce electric spending
could include shifting usage from on-peak to off-peak periods of the
day which will reduce costs even though there is still the same amount
of consumption, and smoothing demand to be more equally distributed
throughout the day, which will decrease the peak load which can save
money.
Rate Changes Over Time
Another benefit of integrating electric rates with SkySpark is capturing rates as they change over time. Electric rates change frequently; rate schedules for some utilities have changed a few times a month. Others change less often. SkySpark can save historical rates, so as rates change over time SkySpark can be useful in analyzing the changes and can use patterns to help predict rate changes in the future. This can be very useful to the end user when trying to budget upcoming electric expenses.
The
complexity of rate schedules and how they
are implemented is an ever-increasing challenge. We see changes in rate
design from traditionally simple rate structures to more complicated
designs. Many rate plans are now including demand charges when in the
past they just included charges for consumption. Demand response
programs are also becoming more prevalent, and more complex. As an
example, Southern California Edison’s Critical Peak Pricing demand
response program imposes an extremely high surcharge from 2 to 6 PM
twelve times a year on the highest system use days. In SCE’s TOU-GS-3
schedule, the additional charge per kWh is $1.37453 for all consumption
during the Critical Peak event. The end user account needs to be
aware of these charges to avoid use during these events as much as
possible.
Because
of the high frequency of rate changes, and the complexity of
the rate schedules needed, it can be a good option for most to consider
using a rating service. Rate providers, such as RateAcuity, can
be used to download rates directly into the SkySpark platform saving
the end user or integrator from the tasks of finding the correct
electric rates, building them into SkySpark correctly, and keeping them
up to date.
 Calculating Energy
Costs
Calculating Energy
Costs
Based on
Real World Complex Utility Rates:
The Role of Rate Modeling and a
Tariff Engine
John Petze
Being
able to calculate actual energy costs for electricity and other
resources such as water, fuel oil, and natural gas is a critical
element in applying data analytics to drive financial benefits for
building owners and operators. We have just seen the substantial impact
utility rates can have on energy costs as well as the challenges
involved assigning actual costs to energy use and analytic findings due
to rate complexity.
In order to understand the impact rates will have on a facility under actual operating conditions, we need to be able to able to calculate the cost of usage and correlate those costs to equipment operation and performance issues and faults identified by analytic rules.
In
order to achieve that goal, we need software that can “model” the
various charges that make up a rate and perform the complex
calculations necessary to turn energy use into dollar equivalents based
on those charges. By doing so, a Tariff Engine enables precise
calculation of actual energy costs.
Rate Modelling. When we
refer to “modelling” a rate we mean the ability
to capture the various charges that make up an electric rate. Costs for
energy go far beyond simple consumption (kWh) and demand (kW). Utility
rates often have a wide range of charges including:
The Tariff Engine. Once
the “charges” that make up a tariff rate are
defined, the next step is to assign the tariff to the meters that
measure energy use. The Tariff Engine then calculates energy costs
based on the charges and actual energy consumption data. Analytics
rules and algorithms can then use those detailed cost calculations to
calculate the cost associated with issues it detects in the operation
of equipment systems. The result is a precise calculation of costs
associated with the use, and misuse, of energy resources.
They are addressing Charges that Change
Over Time. As discussed
earlier, tariff charges often change over time. This adds additional
complexity to cost calculation. The tariff engine needs to be able to
use a historical record of charges over time to accommodate this
situation.
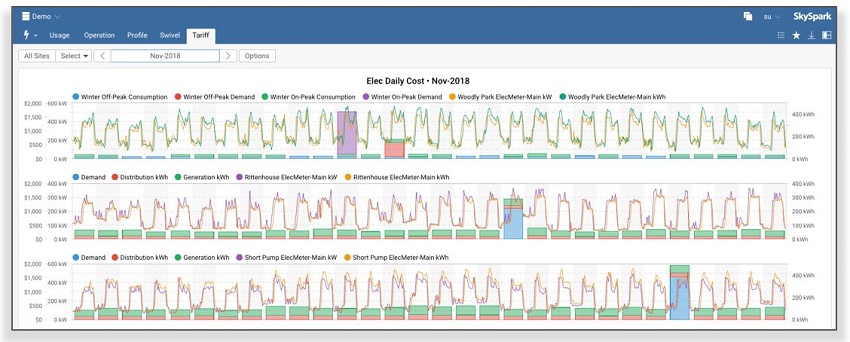
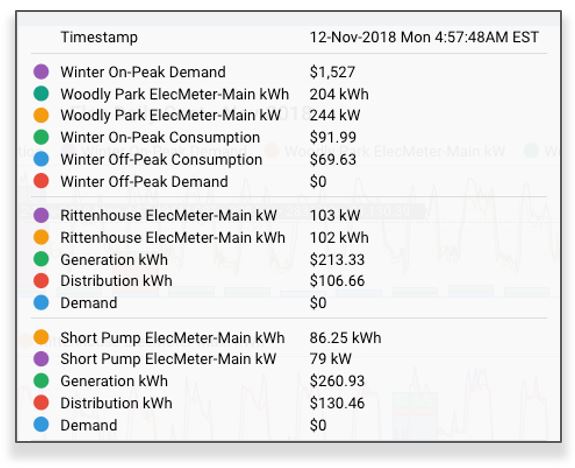
Presenting tariff-based Energy Costs.
The final step is to present
tariff-based energy costs to operators in a meaningful way. The view
below shows the presentation of energy consumption and demand
correlated to tariff-based costs over the course of a month for 3
separate facilities. The lines show consumption and demand and the bars
show tariff-based costs.
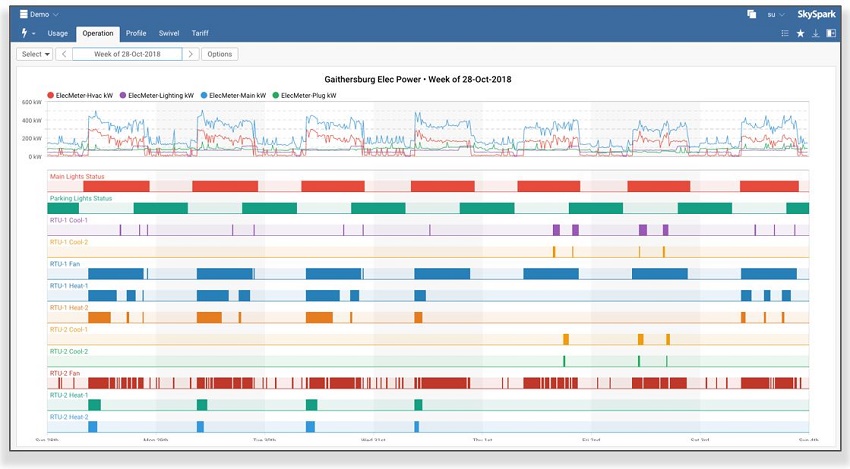
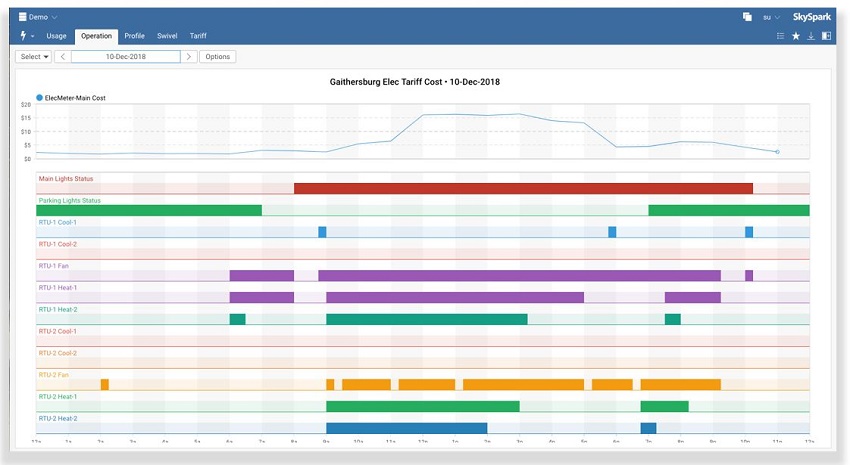
If
we drill into the next level of detail, we see energy use correlated
with equipment operation (shown first in a weekly view) and finally
equipment operation correlated with energy consumption shown in a
detailed daily view. This provides a direct correlation between the
operation of equipment systems and the resulting impact in energy use,
demand and cost.
One of the key benefits this level of detail provides is the clarity
and visibility it brings to understanding the impact of operational
issues. It gives facility operators financial and reporting tools on
par with the sophisticated tools used in other departments enabling
them to more effectively make their case to justify maintenance
priorities and capital expenditures to improve facility performance and
reduce operational costs. Data, when presented correctly truly, is a
powerful tool. Being able to present cost data enables facility
managers to:
Today, the ability to calculate the true costs associated with energy
use by utilizing detailed tariff rates provides owners with actionable
insight to drive more efficient, intelligent data-driven facilities
management.
About the Authors:
Leighton J. Wolffe, the co-founder of NorthBridge Energy Partners, has more than 25 years of experience in the facilities, process and energy industries. His interest in technologies led to leadership positions with energy companies, manufacturers and systems integration firms designing and developing innovative hardware and software applications.
Leighton’s experience across multiple industries and customer segments
enables him to play an integral role in the development and deployment
of successful strategic business initiatives and enterprise level
projects. Leighton provides expertise and domain knowledge to help
clients navigate their way through the highly dynamic intersection of
energy markets, emerging technologies and industry players.
[an error occurred while processing this directive]
He is professionally active on a national level with manufacturers,
software developers, systems integrators, facility professionals,
government agencies and serves in key roles as owner’s advisor,
technical consultant and facilitator providing knowledge of technology
and industry trends. In a previous position as VP Strategy for
Constellation Energy, Leighton founded the NewEnergy Alliance and
formed commercial relationships with over 40 energy technology
companies to develop applications and deliver solutions around
Constellation’s VirtuWatt Platform, which connected buildings directly
to energy markets and Constellation’s trading desk. Leighton is
co-developer for this ground-breaking platform.
Contact information:
leighton@northbridgeep.com
Stephanie Fetchen is a Co-President at KFR Services, Inc., the parent
company of RateAcuity. RateAcuity is a comprehensive database of
electric utility rates throughout the US. Stephanie has been at
KFR Services, Inc. for over 25 years, beginning as a software developer
and working through various roles in the MIS and Operations
departments. Currently, she directs all oversight of software
development activities, including program specification and design,
scheduling, coding and testing. She also developed and champions
the data quality program that has enabled accuracy exceeding 99.98% for
product delivered to customers.
Contact Information:
Co-President, KFR Services, Inc.
sfetchen@kfrservices.com
www.rateacuity.com
John Petze is a partner and Co-Founder at SkyFoundry, the developers of
SkySpark™, an analytics platform for smart device and equipment data.
John has over 30 years of experience in automation, energy management
and M2M/IoT, having served in senior level positions for manufacturers
of hardware and software products including: President & CEO of
Tridium, VP Product Development for Andover Controls, and Global
Director of Sales for Cisco Systems Smart and Connected Buildings group
and is a member of the Association of Energy Engineers. He is the
Executive Director of Project-Haystack.org, an open source, 501C trade
association focusing on standards and technology to make device data
self-describing to enable software applications to automatically
consume, interpret, analyze and present data from devices and equipment
systems thereby unlocking the value of the data.
Contact Information:
John D. Petze
Principal, Co-Founder, SkyFoundry
john@skyfoundry.com
[an error occurred while processing this directive]
[Click Banner To Learn More]
[Home Page] [The Automator] [About] [Subscribe ] [Contact Us]