January 2011 |
[an error occurred while processing this directive] |
|
See How Your Building is Performing - Anywhere, Anytime
Easy to integrate web app offers a creative way to show building performance and educate about sustainable initiatives. |
Sarah Erdman,
|
| Articles |
| Interviews |
| Releases |
| New Products |
| Reviews |
| [an error occurred while processing this directive] |
| Editorial |
| Events |
| Sponsors |
| Site Search |
| Newsletters |
| [an error occurred while processing this directive] |
| Archives |
| Past Issues |
| Home |
| Editors |
| eDucation |
| [an error occurred while processing this directive] |
| Training |
| Links |
| Software |
| Subscribe |
| [an error occurred while processing this directive] |
As a
fully standalone web-based application, it can be integrated into any
IT framework, eliminating many security roadblocks. It runs as a
standalone client or software as a service with no browser constraints,
allowing the data and education components to be accessed from
anywhere, anytime, as long as the application is installed somewhere on
a web server with PHP5 (this can be a range of places including on
hardware in a building lobby, like a touch screen or kiosk, on a
desktop computer, or a web-hosted environment). With the flexibility of
v2.0, the solution is offered as a product with no recurring fees, but
can also be provided as a software as a service solution similar to
other monitoring dashboards.
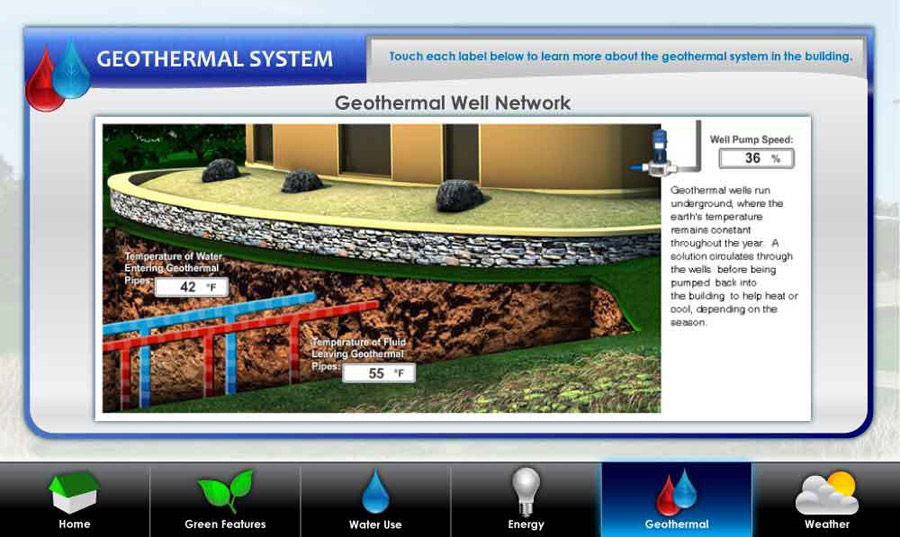
[an error occurred while processing this directive]The
Energy Efficiency Education Dashboard pulls data that is available from
a facility’s existing building automation system or meters and then
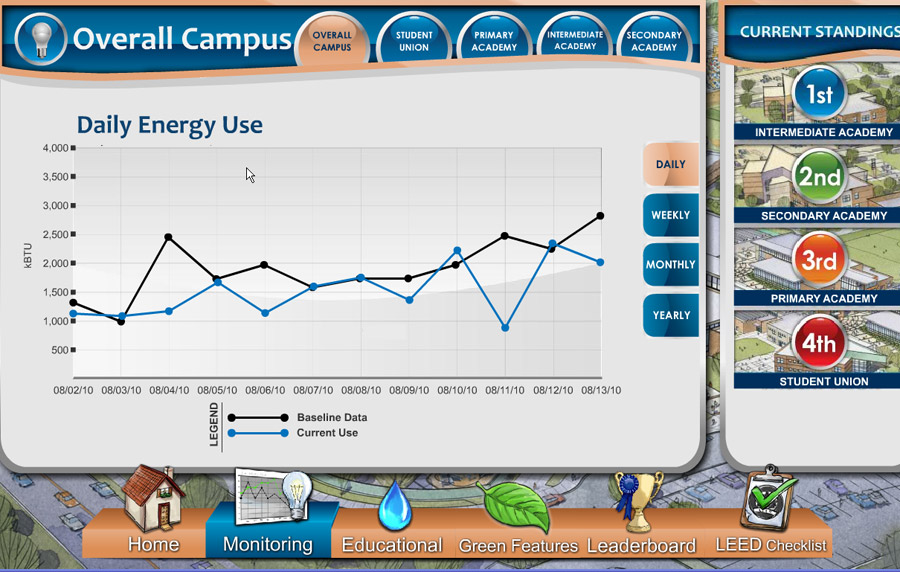
displays it in an easy to understand format. The data can
be shown in hourly, daily, weekly, monthly, and yearly increments, and
can be compared to relevant industry standards, such as an energy
model, energy portfolio, Commercial Buildings Energy Consumption Survey
(CBECS) or other building goals. A number of
educational elements can be used to teach about an organization’s
sustainable initiatives, including demonstrations, interactive quizzes,
a checklist explaining how LEED®, Green Globes®, Energy Star, and other
certifications were achieved, campus view maps, green tips and
more. To further motivate occupants, a friendly competition to
conserve resources can be created with a leaderboard that shows an
ongoing comparison of resource use among multiple buildings or floors
within a building.
Providing
occupants with this education and direct feedback about a building’s
resource use is a trend that will continue to increase. It can
also help earn points under several green building certification
programs. Education solutions such as the Energy Efficiency Education
Dashboard can contribute towards satisfying the U.S. Green Building
Council’s® Innovation in Design Green Education and Innovation in
Design School as a Teaching Tool credits under LEED®, and a variety of
points under The Green Building Initiative’s™ Green Globes® green
building rating and assessment system. When used in conjunction
with other efforts, the solution can achieve up to 34 points under the
Continual Improvement of Existing Buildings track, and up to 27 points
can be achieved under the New Construction track for Green
Globes.
QA Graphics’ Energy Efficiency Education Dashboard has been utilized in
over 400 buildings. To learn more about how an educational dashboard
can be used to display building performance data and sustainable
education that is accessible anywhere, anytime, visit:
http://www.qagraphics.com/eeed or contact serdman@qagraphics.com.
[an error occurred while processing this directive]
[Click Banner To Learn More]
[Home Page] [The Automator] [About] [Subscribe ] [Contact Us]