July 2009
![]()
AutomatedBuildings.com
[an error occurred while processing this directive]
(Click Message to Learn More)
July 2009 |
[an error occurred while processing this directive] |
|
|
|
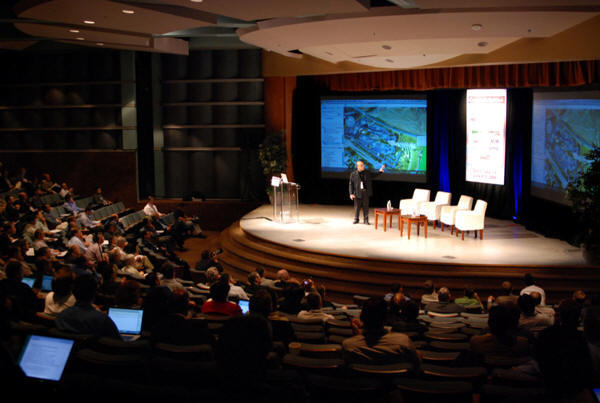
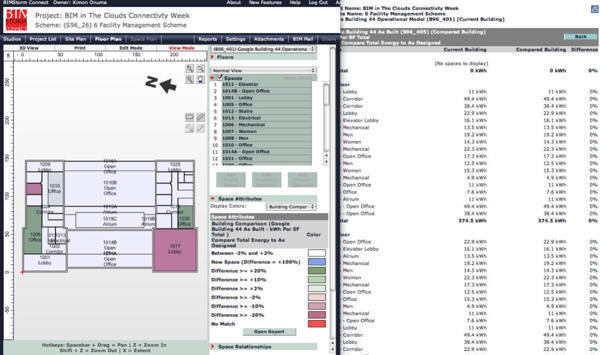
The building industry and the energy industry made an electric connection with BIMStormź at ConnectivityWeek 2009. During the BIMStormź live demonstration of web-based Building Information Model software, ONUMA. Inc. showed the first real time connection between live sensor data and web-based Building Information Models. Now building operators can literally see where energy problems are with the help of building models. The BIMStormź also demonstrated that similarly constructed grid models can allow energy system operators can to see where there are problems on their grids.
|
|
|
|
|
|
|
|
|
|
|
|
|
[an error occurred while processing this directive] |
|
|
|
|
|
|
|
|
|
|
|
|
|
|
|
[an error occurred while processing this directive] |
The ability to see the real-time connections between
building operations and grid operations in web-based BIM will be at the heart of
a rapidly deployed Smart Grid, which is a mission of ConnectivityWeek organizers
and participants.
BIM and BIMStormź Elevator Definition
Building Information Model (BIM) software and processes leverage the power of
visual relational databases to improve decision making and business processes to
revolutionize the building industry.
BIMStormź is a Cloud Computing collaborative process that leverages web-based
BIM capabilities of the ONUMA Planning Systemź to enable data sharing among
multiple software programs including BIM software, GIS systems, Google Earth,
Excel and other sources, even hand drawings. These online Brainstorms allow
surprisingly vast amounts of business processes to be reduced from months to
hours while improving accuracy by not recreating data in each step of a project.
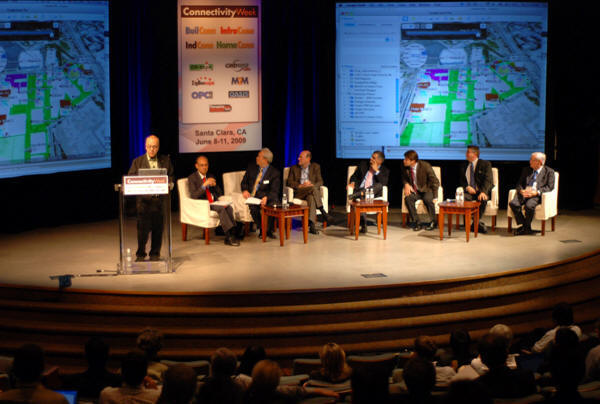
BIMStorm Connect presentation at Connectivity Week
In this first BIMStormź to create live models of renewable energy Smart Grid components, in-person and remote participants also created simple buildings that were landed on San Jose in Google Earth in a matter of minutes. Although simple massing models, the 20 buildings included early energy consumption estimates, cost estimates and other data including visually representing the size of the buildings on a site in Google Earth.
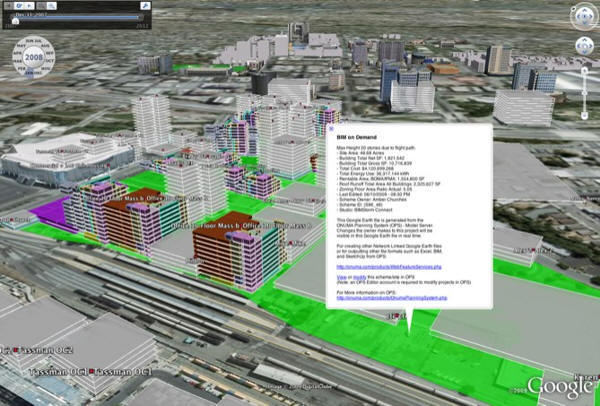
San Jose study created by audience participation.
A San Jose city official in the audience indicated the location of the planned campus was appropriate but some of the building heights were not in line with code. Admittedly a very simple assessment of 1,936,535 square feet of total building space created in the cloud, but it was a strong demonstration of what is possible today with web-based BIM.
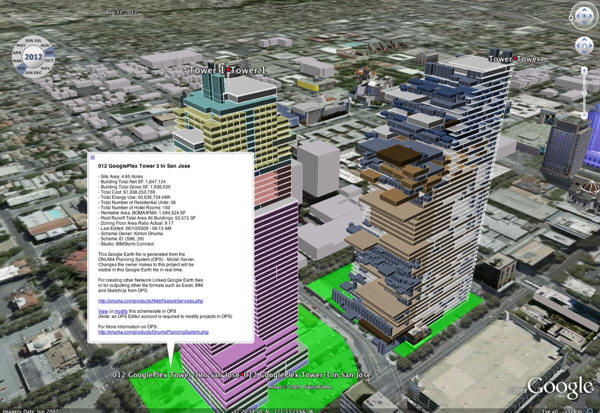
Googleplex landed in San Jose, first in Excel on right and then resolved on
left.
In further demonstration of what is possible today,
renewable energy generation systems were modeled on-the-fly in a matter of
minutes, energy sensor data was shown to be visible live in models on Google
Earth and a buildingSMART alliance GSA demonstration model with pre-calculated
energy analysis was landed next to the GooglePlex on Google Earth.
Named BIMStormź Connect in the ONUMA Planning Systemź project files, the
demonstration showed that the intelligent object process used to create virtual
buildings can be used to create intelligent solar panels, wind turbines, biofuel
generation systems, monitors, meters sensors and other component of the Smart
Grid.
BIMsense live sensor data linked to live BIM in OPS
These virtual components can be linked with GIS
data, cost data, energy data and almost any other data. The components can then
be presented in a visual manner on Google Earth with all of the intelligence
available for review and for transfer to more complex analysis software when
open standards are used.
Smart Grid Models Today
The ability to visualize the virtual Smart Grid components in context can help
improve consensus decision making about complex issues. BIMStormź Connect also
demonstrated that a simple Excel spreadsheet can be used to create a 3D object
of wind turbines and land them on Google Earth in matter of seconds.
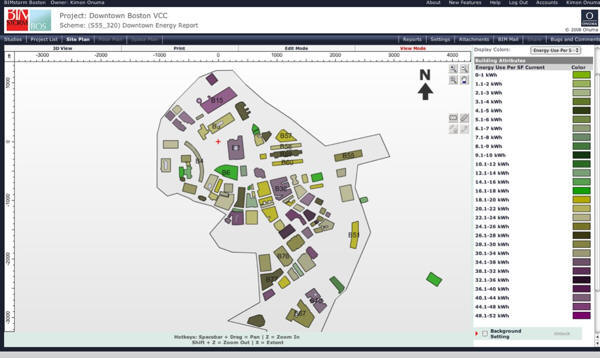
Existing buildings in Boston shown with BIMSense data turned on to simulate
current energy use
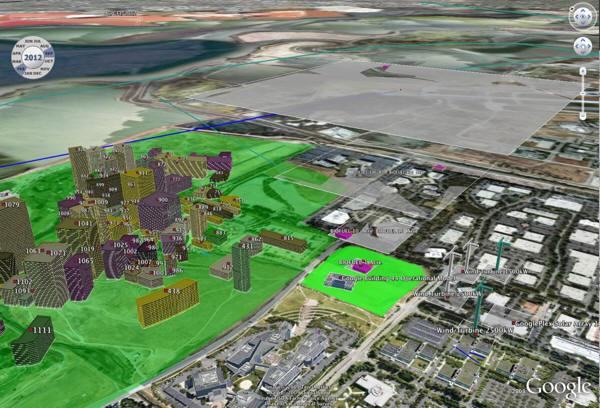
Boston City Building landed adjacent to Googleplex. Energy generators such as
wind turbines and biofuel farms shown on lower right
A biofuel renewable energy generation system was
described in Excel spreadsheets relating the acreage of plantings to production
of seed oil that creates diesel fuel and the amount of electricity created from
the plant detritus. (1 acre = 200 gals seed oil = 170 gals diesel fuel + 4
megawatts of electricity from detritus.) There are more benefits to model, but
with this basic data from an Excel spreadsheet there was enough visual
information created rapidly, but accurately, to achieve consensus that the
acreage needed to create a significant amount of renewable energy required
moving the system from covering the San Jose airport on Google Earth to a nearby
valley.
Solar panels seen on the roof of the GooglePlex on Google Earth and the public
solar energy generation data from Google were used to quickly calculate the size
of the solar array needed to provide all the energy for a new building adjacent
to existing facilities very quickly A new light rail station was added nearby
and downtown Boston was also landed across the street to provide a feeling of
what a dense urban fabric would look like next to the existing GooglePlex.
Live Data Transfer Demonstration
BIMStormź Connect featured remote participation from Vladimir Bazjanac, PhD, of
University of California at Berkeley and the Lawrence Berkeley National
Laboratory. Bazjanac presented energy analysis highlights from a recent
buildingSMART alliance and Open Geospatial Consortium demonstration project.
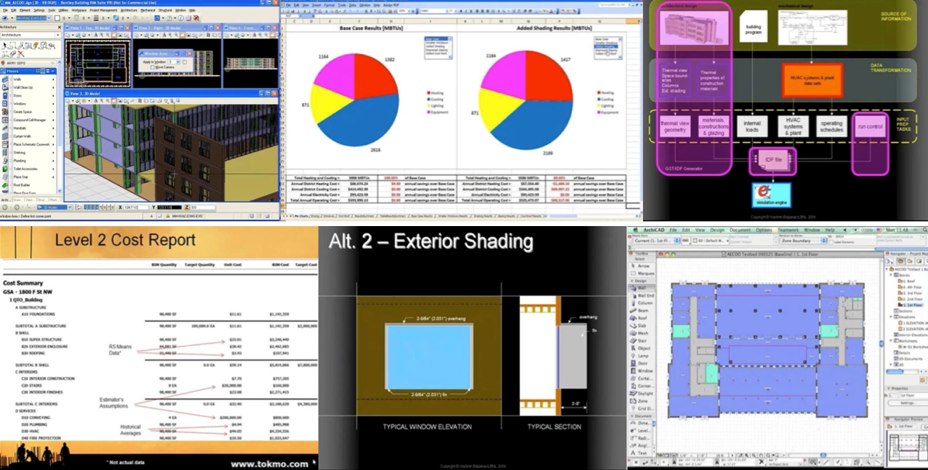
The AECOO-1 Testbed started by modeling a GSA building in Arhicad, included transferring the model data across Bentley's ProjectWise to one of Bentley's many BIM programs for design development, EnergyPlus for energy analysis, Tokmo for cost analysis and scheduling and into other energy analysis programs to show the capabilities of Industry Foundation Class (IFC) standards.
The project proved how multiple software programs
that are compliant with the National BIM Standards and Open Geospatial Standards
can share data in a way that greatly accelerates planning, design, analysis and
modeling of all systems to greatly enhance energy performance of buildings.
Bazjanac showed how some window energy analysis was reduced from 2 weeks to 14
seconds when software properly complies with National BIM Standards.
In the buildingSMART alliance demonstration, an actual General Services
Administration building was modeled in Graphisoft's Archicad, transferred
through Bentley's ProjectWise project management software to Tokmo for costing
and scheduling, EnergyPlus for energy analysis and to other programs.
Additional data transfers to other programs were made and at BIMStormź Connect
the model with all related data was landed next to the GooglePlex complete
with energy analysis.
[an error occurred while processing this directive]
Overview
In a very short amount of time, significant improvements in real-time business
process productivity supported by existing technology were demonstrated. Early
planning decisions were made quickly based on expert knowledge brought in from a
distance, the decisions were captured and used in more detailed designs and
passed on to building operators with minimal loss of data.
Early models were then able to be used for real-time sensor data display during
building or energy grid component operation.
Using open standards, as demonstrated by the National BIM Standards and the Open
Geospatial Consortium GIS standards point to how building data and Smart Grid
data can be aligned to provide surprisingly quick increases in productive
building and grid inter-operation.
In addition to leading the BIMStormź Connect, Kimon Onuma, FAIA, participated in
the opening plenary session, the closing plenary Mega Panel and three other
panel presentations. Also, the ONUMA Planning Systemź was honored with a Smart
Services Buildy Award by popular vote of conference attendees.
About the Authors
Graphisoft once again generously provided a software prize to the highest level
of participation in BIMStormź. The BIMStormź Connect Graphisoft Prize was
awarded to the City of San Jose.
Kimon Onuma, FAIA is an architect and a software architect who has been a
leading proponent of open standards to improve productivity and reduce waste in
the building and energy industries. Pasadena, Calif.-based ONUMA, Inc. has won
numerous awards for its significant contributions to multiple professional
associations. ko@onuma.com
Michael Bordenaro is a Co-founder of the BIM Education Co-op, whose mission is
to accelerate understanding and adoption of Building Information Model software
to increase productivity and profitability in the building and energy
industries. mbordenaro@cs.com
[an error occurred while processing this directive]
[Click Banner To Learn More]
[Home Page] [The Automator] [About] [Subscribe ] [Contact Us]