July 2010
![]()
AutomatedBuildings.com
[an error occurred while processing this directive]
(Click Message to Learn More)
July 2010 |
[an error occurred while processing this directive] |
|
|
Andrew deCoriolis |
You have demonstrated your commitment to environmental stewardship by investing in energy efficiency. Yet the presence of solar panels or energy-saving equipment and other green features in your buildings does not in itself ensure that occupants, clients, students and visitors gain insight into the benefits of these efficiency improvements. How do you maximize the value of your investment? How do you engage these audiences so that they directly experience, learn from and respond to the environmental consequences of your decisions? How do you make the invisible visible?
|
|
|
|
|
|
|
|
|
|
|
|
|
[an error occurred while processing this directive] |
|
|
|
|
|
|
|
|
|
|
|
|
|
|
|
[an error occurred while processing this directive] |
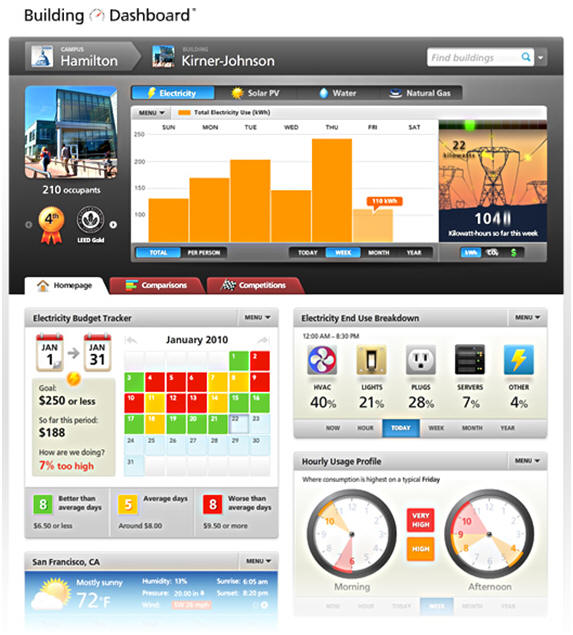
An automated monitoring and public display system (Lucid Design Group refers to this as a �Building Dashboard��) provides a valuable and dynamic tool with which to demonstrate an organization�s ongoing commitment to environmental stewardship. In general, such a system should enable building occupants and visitors to view, experience and understand the positive environmental implications of green design and management.
My interest and involvement in data monitoring and display grew out of my experience as a student attending Environmental Studies courses in one of the first green buildings on a college campus. Walking in and out of class I passed, and often stopped to view, a monitor displaying the resources currently being consumed in the building and on campus.
Seeing that information I couldn�t help but equate what I was learning regarding the impacts of consumption with how my surroundings and actions contributed to those challenges. Since then I�ve joined several classmates and friends at Lucid Design Group where we continue to design and implement systems that engage, educate, motivate and empower building occupants to change their behavior and reduce resource use in their buildings.
Features to look for in data
acquisition and display software
The opportunities for display are made possible by and also constrained by
hardware and software. In the planning process, it is therefore critical to
select a system that is robust and flexible. Look for the following key features
in data monitoring software:
The software is designed to capture and integrate data from multiple sources into a common database.
The software is capable of post-processing data on multiple time scales to convert and combine acquired data into unit equivalents of that are meaningful to non technical audiences.
The vendor provides a range of available graphics and the ability to customize graphics to suit the particular needs and style of your organization.
The software is socially networked allowing for communities to develop around individual buildings.
The software provides socially contextualized features that allow for building occupants to engage and organize around resource use information.
Conveying Compelling Information
Websites, large lobby displays and smaller kiosk displays are three primary
means by which real-time dynamic data on building performance can be conveyed to
the public. Each of these provides a different set of opportunities to connect
and interact with desired target audiences. Lobby and touch-screen kiosk
displays should be tailored to building occupants and visitors. Web sites can
easily be designed with sections that speak to a broader diversity of audiences,
for example with sections designed to appeal to children and other sections
designed for potential clients.
[an error occurred while processing this directive] For lobby and kiosk displays, physical placement is obviously an important consideration. On one hand, central locations that building visitors naturally pass by provides exposure to the broadest audience. On the other hand, locations in spaces that naturally encourage the visitor to pause and spend some time examining the information maximize the opportunities for engagement and reflection. A lobby display can be an important component of building tours, in which case a large enough screen is needed to accommodate groups.
Engage & Promote Interactivity
Research indicates that we acquire, retain and understand information most
effectively through active rather than passive modes of learning. A
well-designed display should go beyond navigation options; active learning means
that the visitor is encouraged to become a participant in improving
environmental performance. There are three primary types of interactivity which
should be incorporated into a data monitoring and display system. The first is
by providing the viewer with feedback on how his or her own actions affect
building performance. For instance, the viewer turns on a light switch, changes
a thermostat setting or takes a drink from a water fountain then directly and
immediately views the consequence of these decisions on the display.
The second type of interactivity concerns the opportunities a viewer has to manipulate data that are presented on the display. For example, when a visitor moves a cursor through a time-series graph she should be able to see gauges move to correspond to the value of other variables at the specified moment in time.
The third is through social interaction and socially contextualized information. Understanding what you are consuming compared to what your neighbors, peers or classmates are using is important normative information that inspires behavior change. Our Building Dashboard� software, for example, makes it possible to compare consumption in one building to average building consumption across a campus. Occupants of these buildings can also launch real-time residence hall competitions to reduce consumption. Data on the dashboard are connected seamlessly with other social networking websites, including Facebook and Twitter, where summaries, alerts and updates can be posted automatically to the personal profile pages of building occupants. Integration with third-party social media platforms makes building resource use data even more visible and accessible.
Planning the Design Process
When should planning begin for a data monitoring and display system? The simple
answer to this question is now (maybe yesterday). The earlier that planning for
monitoring and display begins, the easier it is to design a system that is cost
effective, takes advantage of the capabilities of existing building control
technology, meets the project goals and takes full advantage of opportunities
provided by the site. Our experience has been that an early commitment to
monitoring can sometimes leverage project funds for green design. For example,
the educational, public relations and marketing benefits of a data display can
play a critical role in exciting potential donors and clients and in selling
green design features to reluctant participants in the design process. As an
added benefit, a data monitoring and display system can help a building qualify
for credits towards a LEED rating. Although it is never too early to begin
planning for a data monitoring and display system, it is likewise never too
late. In preexisting buildings, data monitoring and display systems can be used
to feature green renovation, but they can also play a unique role in generating
feedback that allows building users to teach themselves how to better conserve
resources. As with new buildings, a data monitoring and display system can
contribute to achieving a LEED EB rating.
[an error occurred while processing this directive]
[Click Banner To Learn More]
[Home Page] [The Automator] [About] [Subscribe ] [Contact Us]