July 2010
![]()
AutomatedBuildings.com
[an error occurred while processing this directive]
(Click Message to Learn More)
July 2010 |
[an error occurred while processing this directive] |
|
|
Sarah Erdman, |
Sustainability is at the top of nearly every building owner and operation manager’s agenda. The 2010 Energy Efficiency Indicator report, published by Johnson Controls, Inc. and the International Facility Management Association (IFMA), shows that green building is expected to continue to increase in 2010. The report describes the energy efficiency trends throughout North America, with data compiled from surveying over 1,400 participants who are responsible for managing and improving commercial buildings’ energy use. Of those surveyed, 85% of new construction projects and 78% of retrofit projects will utilize green elements with many being certified to a recognized green standard.1 And of those surveyed, 84% also value energy efficiency as a priority in those projects.1
|
|
|
|
|
|
|
|
|
|
|
|
|
[an error occurred while processing this directive] |
|
|
|
|
|
|
|
|
|
|
|
|
|
|
|
[an error occurred while processing this directive] |
Maintaining an energy efficient building requires an effort from both the building operations team and occupants, and education is the key to facilitating awareness and the encouragement of efficient resource use. According to the Energy Efficiency Indicator report, 63% of those surveyed say they are educating their facilities operations staff and 61% are educating their building occupants to encourage energy efficiency.1 A common trend among organizations is to provide real-time information that shows the building’s resource use and explains what sustainable features in the building contribute to conserving those resources. As the need for this education increases, two different types of dashboards have emerged: energy dashboards and energy education dashboards.
An energy dashboard provides much more technical information than an energy education dashboard. It consists of a series of gauges, graphs, and live display values that provide a building operator with a summary of the important energy metrics within their facility. These dashboards are very useful and are typically utilized by the operation management side. In fact, one “dashboard” definition even defines it as a reporting tool that presents key indicators on a single screen, which includes measurements, metrics, and scorecards.
While an organization’s management team can proactively manage a building’s resources, it’s just as important that the occupants are aware and involved in this effort. The second dashboard to emerge is the energy education dashboard, a dashboard that is used to provide education and facilitate the widespread understanding of sustainable building. Educating building occupants on measures they can take to be more energy efficient can actually reduce the resource consumption within a building, and proper education on sustainability efforts can ensure those efforts continue into the future.
Energy education dashboards focus more on education about a building’s efficiency and sustainable features than the technical information that operation management would utilize. Real-time resource use is provided to give occupants insight on how their actions directly impact the building, and the data is presented in an easy to understand format, at a more simplified level than what a building operator might expect to see. Another important aspect of displaying this building data for occupants and the public is to benchmark that data versus a baseline energy model, an ASHRAE standard, or even against another company or governmental goal. Seeing how a building compares to others is very informative, especially when that energy savings can be translated into monetary savings. Even though the data is simplified, it is still helpful for facility managers and building owners to review this data; mainly, because the information is so easy to access. Many energy education dashboards are presented on a touchscreen, located in a building’s main lobby for example, as well as through the organization’s intranet or internet for the public to see.
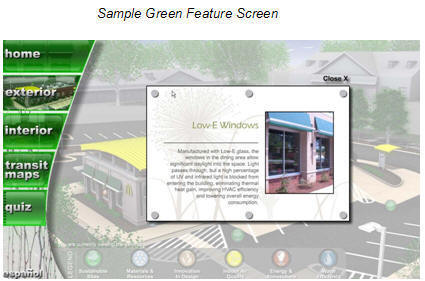
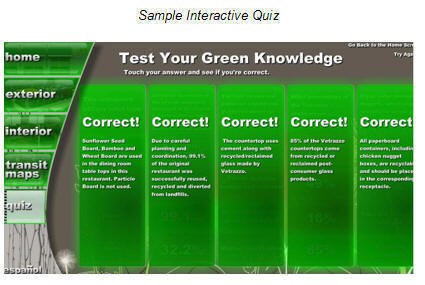
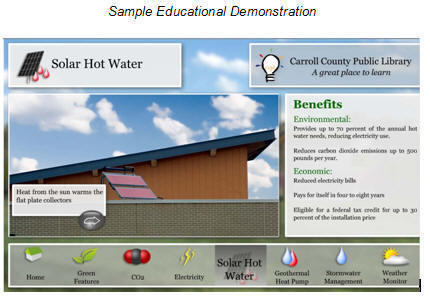
The educational factor is really what differentiates an energy education dashboard from a traditional energy dashboard; it allows viewers to understand how the sustainable features used in the building actually work and benefit the environment. Interactive quizzes, demonstrations, videos, pictures, LEED checklists and information can all be used to show what sustainable features are in place, and how those features save money and resources. Educational features might include demonstrating how a solar hot water panel system collects solar energy to help provide hot water to a facility, or how geothermal systems use the constant temperature from the Earth to heat or cool a facility. Another popular feature is to provide tips on how everyone can make changes in their own lives to be more sustainable.
[an error occurred while processing this directive] Energy education dashboards are also used to motivate occupants to conserve resources. A leader board can be used to display real-time and historical energy use and compare the usage among multiple buildings or floors within a building. For example, a leader board can be used to create a competition among dorms on a campus, or even each floor within a single dorm building, to see who can be the most efficient. Implementing this type of module can make being resource conscious fun and encourage occupants to be more involved in energy conservation.
Providing this education and direct feedback about a building’s resource used is a trend that continues to increase. A very important factor of any energy education dashboard is that is easy to use by all ages, especially children. Schools, universities, libraries, commercial buildings, government buildings and the hospitality industry are utilizing energy education dashboards to showcase their sustainable achievements, and to educate viewers on how they too can make a difference. The U.S. Green Building Council (USGBC) also encourages ongoing education to ensure a building is maintained and operated efficiently. If applying for the U.S. Green Building Council’s LEED certification (Leadership in Energy and Environmental Design), incorporating an energy education dashboard into the sustainable plan may help achieve LEED Innovation and Design credits.
An example of an energy education dashboard is QA Graphics’ solution called the Energy Efficiency Education Dashboard. QA Graphics helps organizations display live resource use and educate about the building’s sustainable features. To display resource use, the data can be gathered a number of ways; the most effective way that we have determined, is accessing that data through the existing building automation system and displaying that data in a more clear and easy to understand format. Their applications follow design standards similar to websites since most people are familiar with interacting with that type of user interface, and many of the displays are editable, allowing the end-user to continue to update the information shown as their sustainable initiatives change. The following examples show how organizations have used our Energy Efficiency Education Dashboard to provide education.
Restaurant Utilizes Energy Education Dashboard: The third green McDonald’s restaurant in the U.S. uses an energy education dashboard to educate the public on the restaurant’s economic and environmental benefits. This McDonald’s is owned and operated by Ric Richards of The Richards Advantage, Inc., a 20-year-old McDonald’s franchise organization. The application is displayed in the lobby on an interactive touch screen, where users can learn about the green features used throughout the building. An interactive 360-degree digital tour of the building shows the sustainable features, including LED (Light Emitting Diode) lights, Solatubes that provide natural light, electric car charge stations, recycled countertops, flooring, décor and more, with all of the information viewable in English and Spanish. After learning about the green features, users can test their knowledge with a ‘green’ quiz. “Everyone’s overall reaction to the dashboard has definitely brought the WOW factor to a new level,” said Ric Richards, owner of the restaurant. “It’s so unique and different; people are walking right up and touching the dashboard right away.”
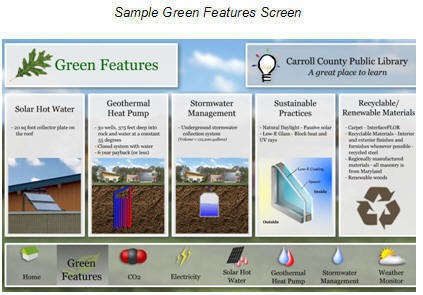
Library Utilizes Energy Education Dashboard: Carroll County Public Library uses an energy education dashboard to educate staff and patrons on the building’s energy consumption in real-time, as well as educational demonstrations to show what green initiatives are in place at the library. The application is presented on an interactive touchscreen where users can check the weather and learn more about the library’s various green features, including a geothermal heat pump, storm water management, solar hot water and recyclable materials. “It’s gratifying to see kids interacting with the dashboard and learning how we are helping our environment,” said Scott Reinhart, the assistant director of Carroll County Public Library.
References:
1Energy Efficiency Indicator – North America 2010:
April 19, 2010, International Facility Management Association & Johnson
Controls, Inc.
To learn more about the differences between energy dashboards and energy education dashboards, contact Sarah Erdman at serdman@qagraphics.com or 515.965.3403.
To learn more about QA Graphics’ Energy Efficiency Education Dashboard, visit www.qagraphics.com/energy-efficiency-education-dashboard.
[an error occurred while processing this directive]
[Click Banner To Learn More]
[Home Page] [The Automator] [About] [Subscribe ] [Contact Us]