Data Wrangling for Breakthrough Energy
Performance
Analytics can easily shave 20% off your energy costs
 Jack Mc Gowan, CEM
Principal
The Mc Gowan Group published
May BUILDINGS
|
June 2016 |
[an error occurred while processing this directive] |
|
Data Wrangling for Breakthrough Energy
Performance
Analytics can easily shave 20% off your energy costs |
Jack Mc Gowan, CEM Principal The Mc Gowan Group published May BUILDINGS |
| Articles |
| Interviews |
| Releases |
| New Products |
| Reviews |
| [an error occurred while processing this directive] |
| Editorial |
| Events |
| Sponsors |
| Site Search |
| Newsletters |
| [an error occurred while processing this directive] |
| Archives |
| Past Issues |
| Home |
| Editors |
| eDucation |
| [an error occurred while processing this directive] |
| Training |
| Links |
| Software |
| Subscribe |
| [an error occurred while processing this directive] |
Buildings are complex organisms with systems and occupant patterns that are in continuous flux. Thanks to ENERGY STAR and other sources, benchmarking data exists to compare the energy performance of similar buildings. However, such data shows wide and unexplained differences in performance among similar buildings. What are the roots of superior performance? And for buildings already performing at high levels, is it possible to break through to higher performance?
For
answers, we must drill deeper than benchmarking data allows and tap
the power of big data energy analytics. Even skilled managers confront
a bewildering host of known and unknown factors that affect performance
in every building. Analytics technology can unlock dramatic savings,
easily 20% of energy costs, while ensuring ideal occupant environments.
Making Analytics a Part of the
Routine
Building managers tend to focus on maintenance and system upgrades.
Analytics – or “data wrangling” as I like to call it – elevates such
routine activity to continuous building improvement by adapting to
equipment operations and occupancy patterns. Through combinations of
commissioning, preventive maintenance and equipment upgrades, it can
facilitate performance breakthroughs that exceed building benchmarks.
Because the diversity of systems in buildings adds complexity, the
first step is understanding applications that should be optimized, such
as HVAC systems and the facility’s Energy Utilization Index (EUI). Once
applications have been identified, engineers and other “data wranglers”
are deployed to create rules or parameters that define ideal operation
for these applications.
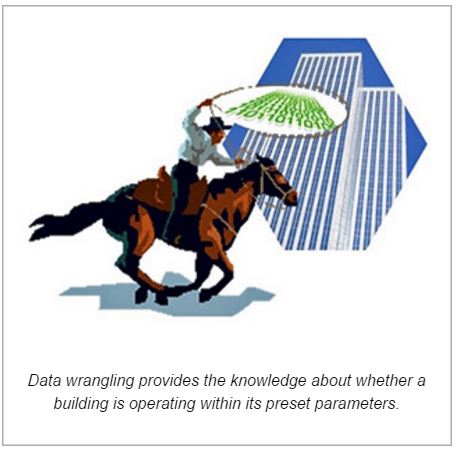
With rules defined, analysts can identify what data is necessary to
test whether a building is operating within parameters. That data is
then evaluated against the rules to determine performance. Analytics
software engines crunch the data to identify patterns, issues, faults
and trends. In this sense, the big data approach is different than,
say, buying a new high-efficiency LED lamp, which is a product-based
solution.
Rules in analytics are best illustrated by referencing a single piece
of equipment. For example, a rule might define ideal operating
parameters for a particular type of VAV box, including a set of values
for each operating condition (discharge and return air temperature,
zone temperature compared to setpoint, static pressure, etc.).
Analytics tools access the data from the equipment and compare it to
the rule to determine if a unit is operating properly.
Getting started with analytics is easy. If you have access to operating
data (energy consumption, equipment trends, etc.), you can start the
journey to data-driven performance. Because you can’t manage what you
can’t measure, a single building that is utility metered or a metered
process is a good starting point. If your building has a building
automation system (BAS), it should be a valuable resource of
data. Typically there is some level of integration needed to get
data from the BAS to analytics tools, but once data is flowing, these
tools will begin producing ideas for improvement. As financial results
accrue, go further.
The Potential of “Self-Describing”
Data
Facilitating the flow of data from the BAS to the analytics application
has great potential for improving performance results. The data should
follow standards that make it able to define itself or “self-describe.”
Project Haystack (project-haystack.org) and ASHRAE (BACnet.org) have
assembled industry experts to work on consensus-approved approaches to
describing data so it can easily be consumed by cloud-based analytics
tools. Algorithms evaluate whether conditions meet the rules or require
adjustment.
This software analysis converts volumes of unconnected data into
knowledge. Analytics tools don’t just trigger alarms, they provide
actionable knowledge in a format that can be quickly understood by
operations personnel. Managers know whether buildings are performing to
expectations, and if not, why not. Tools provide lists of
recommendations summarizing what’s wrong and what’s necessary to meet
or exceed performance expectations. They tell us how long the problem
has existed, what it will cost to fix it and what skills are needed.
This information is conveyed through executive dashboards that provide
the knowledge necessary to truly break through previous barriers to
high performance buildings.
About the Author
John J. “Jack” McGowan is Principal with The McGowan Group and former
CEO of Energy Control Inc. (ECI), an OpTerra Energy company. He is
Chairman Emeritus of the U.S. Department of Energy GridWise
Architecture Council. In 2003 the Association of Energy Engineers (AEE)
admitted him to the International Energy Managers Hall of Fame. His
book, Energy and Analytics: Big Data and Building Technology
Integration was recently published by Fairmont Press
(www.fairmontpress.com) and he instructs an AEE seminar on analytics
(aeeprograms.com/Realtime/BigData/).
[an error occurred while processing this directive]
[Click Banner To Learn More]
[Home Page] [The Automator] [About] [Subscribe ] [Contact Us]