Visual Depictions of Data
Visual depictions of data are almost universally understood
without requiring knowledge of language.

Nino Kurtalj, President,
March 2011 |
[an error occurred while processing this directive] |
|
Visual Depictions of Data
Visual depictions of data are almost universally understood
without requiring knowledge of language.
|
Nino Kurtalj, President, |
Operating cost awareness increasingly utilizes Building Automation
Systems. The owners' endeavor to save energy, not compromising
occupant comfort, is one of the key points for the penetration of smart
building technology into the sector and it is rapidly increasing globally.
Clearly, the wealth of the nation significantly depends on how
efficiently we use our resources.
| Articles |
| Interviews |
| Releases |
| New Products |
| Reviews |
| [an error occurred while processing this directive] |
| Editorial |
| Events |
| Sponsors |
| Site Search |
| Newsletters |
| [an error occurred while processing this directive] |
| Archives |
| Past Issues |
| Home |
| Editors |
| eDucation |
| [an error occurred while processing this directive] |
| Training |
| Links |
| Software |
| Subscribe |
| [an error occurred while processing this directive] |
Recently, I was asked to present smart building possibilities at a conference which was specially addressing hospital energy
issues. Preparing for the presentation I found graphs in one of the
CADDET brochures, with the Energy Consumption for hospitals in
different countries.
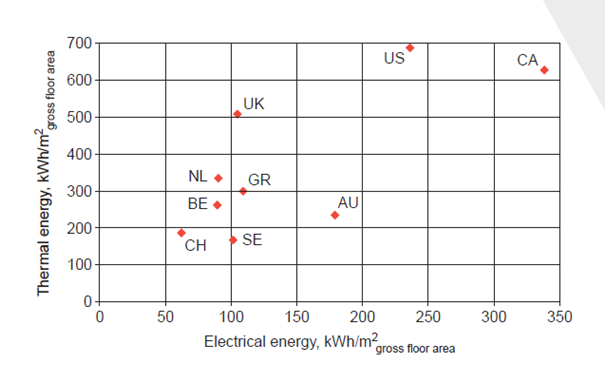
On the graph, it is clearly indicated that Switzerland and Sweden
have the lowest electrical and thermal energy consumption per gross
floor area. Compared to the US their consumption is around 1/3 for typical hospital stock. Typically, such kind of
data is in energy reports. How effectively can we use such
knowledge if it is frozen within the pdf type of document? How many
Building Managers are aware of the existence of this information? I
do not have the answers, but I know that having the opportunity to
compare in real time our facility energy consumption with corresponding
typical similar facilities in various countries could
change and reposition our view and understanding of our facility.
It could as
well significantly influence our reconstruction strategies.
Making our data public could help us to better
understand our position. Internet technology has reached the
point where
real time information as a service can remodel managing buildings.
Unfortunately, most of the installed systems hardly use these
features and capabilities, simply because of the nature of how the BMS
industry works with their customers. Most BMS vendors claim that their
system is the best one. In almost every
brochure you will find that in comparing to the other vendors their
particular
one provides significantly more value to the customer. However, rarely
will you will find a comparison as in the graph above. Let’s face
it, we need to compare our KPIs with the average industry ones, and
through that, the progress and adaptation of the industry will speed up
making the open intelligent building model dominant. How
to compare different facilities? They are different, and as with
every statistic we could be comparing pears with
apples. How to be sure that the numbers fit? One of the answers
could be by establishing good building classification. The second thing
that we will need is the redesigning of the traditional BMS
infrastructure.
We will need to add more sensors, which will then be used for keeping a
good
level of comfort, to predictive and proactive managing and operation.
The ideal system would be self calibrating with diagnostic capabilities
as well as simple to operate. In one word, it has to be
“Smart”.
There are many parameters that the system could utilize as real time
data elements, such as outside temperature, dew point, precipitation,
wind, solar radiation, air quality indicators, energy pricing data as
well as any other data, which could be useful for day to day operation of
the building. Data like people behavior, legislation changes, etc could
be a base for very pragmatic comparisons. As the outside parameters
will influence control sequences of AHU units, boiler rooms and any
other system installed in the building, the business process data will
contribute too. This new knowledge will change control as well business
strategies.
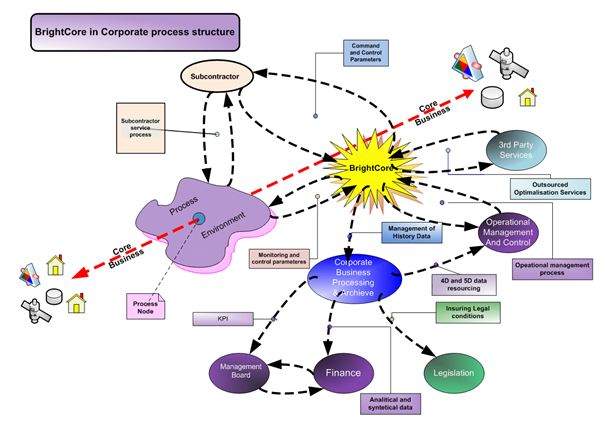
As this image presents, we always have the core business and process
environment, as well as interaction between subcontractors, facility
operations, management and other services. Boundaries of the
system are changed for ever; just national comparisons are not relevant
any more. Global companies understand it very well since they are
covering the global area.
Such intensive usage of real time data needs pure network architecture
and BMS, which are 100% ICT discipline as telephony today. We cannot
rely any more on just client server architecture. Real time outside
services are bringing a producer –consumer model right into the heart of
our industry. Such a wealth of data is changing core company values, and
adding new dynamics to the decision making process.
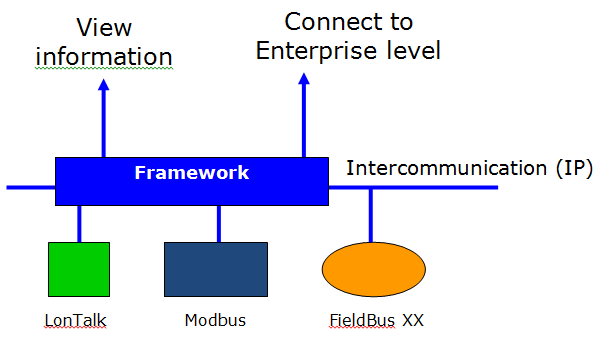
To achieve such simplification and manageability of data from various
data sources – either on-premise or hosted except the general common
data model, we have to establish a common graphic presentation model
too. We need to network real time with database data.
Therefore, interoperability of real time and database data, and their
presentation becomes a foundation for all other developments. Standard
client server model could not support such a request. We have to adapt
a full network model.
The vector based graphic display system could significantly help in
presentation of building data. Usage of open vector formats like SVG or
in more demanding situations some other CAD or BIM format will reshape
usability of building data. Adding layers will open multi usage of
graphics through various services without forcing unnecessarily
details. Features like zoom in on a selected area for more detail
without redrawing the picture significantly facilitates usage of the HMI
drawings.
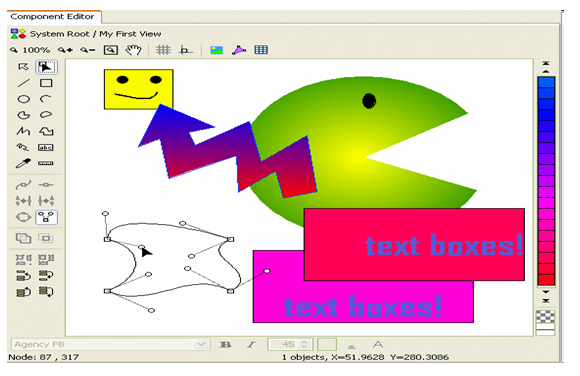
Such an editor is included within the BrightCore framework.
Too often we need to create real –time analysis reports with both
static and inconstant sources of information. Today, we still use
Excel for such tasks. Rarely do we have a powerful Analysis
Framework in such a model. In the open conceptual model, it could be
easy to add such an infrastructure. Integrating energy usage with total
sales per month could be a very easy achievable task. If we have sub
metering, we can go deeply into the analytics of thevCore Business data
with the process environment data.
Now as we can measure everything, our Service Level Agreements have a totally new flavor. The ability and decision to compare energy with sales, as well as to compare support service with the energy opens a totally new segment of utilizing KPI performances. Possibilities are endless.
After we measure, we need to draw a picture. It is an important general
principle in explaining things. Most people will accept visual
information much more quickly than information in other forms. Simple,
visual perception is more immediate than a sequential scan of numbers and
letters. Graphics data presents and shows relationships more
clearly. Visual depictions of data are almost universally understood
without requiring knowledge of language. The purpose of graphical data
is to communicate information clearly and accurately.
The wealth of a nation significantly depends on how
efficiently we use our resources. To be able to understand how we perform graphical data presentation represents a
cornerstone to all future efficiency models.
[an error occurred while processing this directive]
[Click Banner To Learn More]
[Home Page] [The Automator] [About] [Subscribe ] [Contact Us]