 EMAIL
INTERVIEW
– John Petze and Ken Sinclair
EMAIL
INTERVIEW
– John Petze and Ken Sinclair
|
May 2014 |
[an error occurred while processing this directive] |
| |
EMAIL
INTERVIEW
– John Petze and Ken Sinclair
John Petze, C.E.M., is a partner in SkyFoundry,
the developers of SkySpark™, an analytics platform for building, energy
and equipment data. John has over 30 years of experience in building
automation, energy management and M2M, having served in senior level
positions for manufacturers of hardware and software products including
Tridium, Andover Controls, and Cisco Systems. At SkyFoundry he is
working to bring the next generation of information analytics to the
“Internet of Things”.
| Articles |
| Interviews |
| Releases |
| New Products |
| Reviews |
| [an error occurred while processing this directive] |
| Editorial |
| Events |
| Sponsors |
| Site Search |
| Newsletters |
| [an error occurred while processing this directive] |
| Archives |
| Past Issues |
| Home |
| Editors |
| eDucation |
| [an error occurred while processing this directive] |
| Training |
| Links |
| Software |
| Subscribe |
| [an error occurred while processing this directive] |
Sinclair: John, tell us a bit about the new developments SkyFoundry will be showing at the Niagara Summit?
Petze: There have been a tremendous number of advances to the SkySpark
platform since the last summit two years ago – new applications, new
data connectors including integration with Energy Star, an expanded
library of analytic functions, and during that time SkySpark has been
deployed across thousands of buildings.
As far as recent additions that we will be showing at the summit, one
of the areas we have been focusing on is to expand the reporting and
visualization tools to support the workflow process that is essential
to resolving issues and achieving improved operation. We are constantly
enhancing and creating new tools to help operators understand what issues
have been found, the cause, correlations with other issues, and the
cost and energy impact of those issues. All of these tools support the
effort to address issues to improve operations.
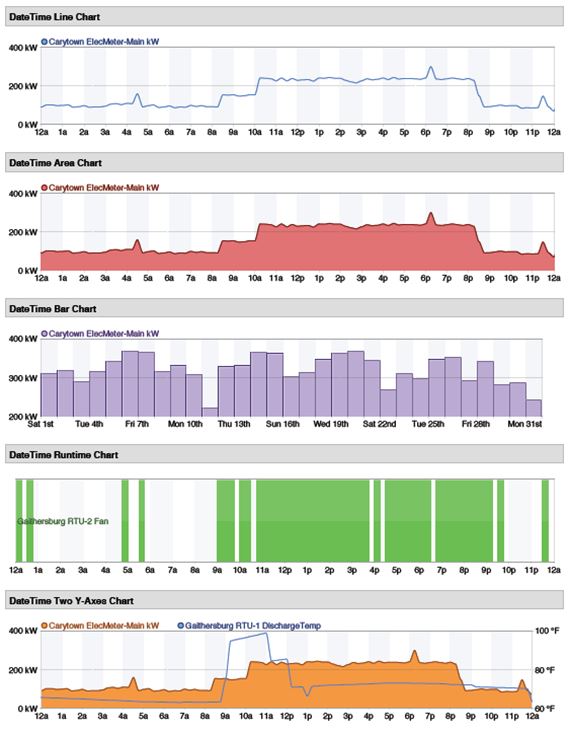
One of the latest additions to SkySpark is a range of tools to create
custom reports to show data, trends, and of course “sparks” – our term
for analytic findings that represent, faults, deviations, anomalies,
and opportunities for savings. We added a range of tools based on user
feedback, as well as the ability to assemble the new views into pdf
reports. These reports can be emailed on a schedule basis too. Here is
a quick view of some examples:
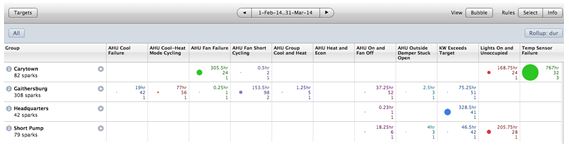
These new tools add to two other very important visualization tools we added a while back – Bubble Charts and KPI displays. Bubble charts help managers see summary information on the issues being detected by analytic rules. For example, summaries of the types of issues being found, how often they occur, how long they last, their magnitude and in many cases their actual cost in dollars. Here is a quick example:
We will be showing these and other new features of SkySpark at the
Niagara summit, April 27-29 in Las Vegas. Attendees can find us in
booth 310.
More information on SkySpark® analytics is available at www.skyfoundry.com
[an error occurred while processing this directive]
[Click Banner To Learn More]
[Home Page] [The Automator] [About] [Subscribe ] [Contact Us]