|
May 2020
AutomatedBuildings.com
|
[an error occurred while processing this directive]
(Click
Message to Learn More)
|
Building
Occupancy Data Reveals the Extent of the US Lockdown
The
occupancy data provided by our smart buildings is giving us visibility
on what happened, and the same data will also provide visibility for social distancing and cost-saving
measures to help us emerge from this crisis.
|

James McHale,
Managing Director,
Memoori
|
The US now has the highest number of COVID-19
cases, and fatalities anywhere in the world and most States are
implementing strict lockdown measures to varying degrees.
Fascinatingly, some of the best data we have on who and when people
started isolating, is building occupancy data from smart buildings.
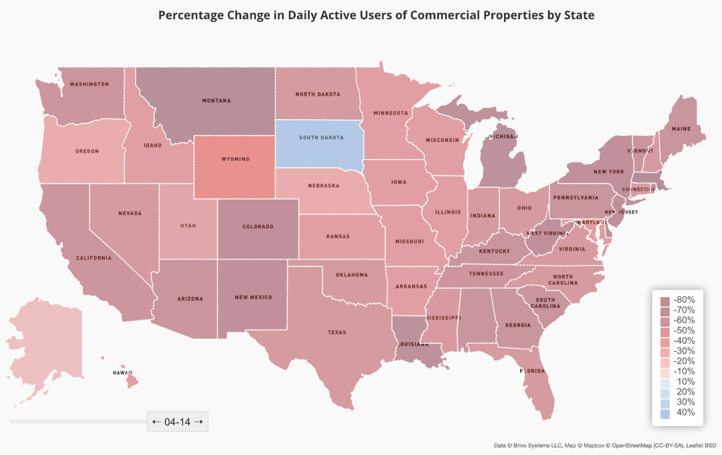
The following
graphic, by access control firm Brivo
Systems, shows the drop in building occupancy numbers
state-by-state. The first states affected, unsurprisingly, those most
connected to the outside world, but soon the whole country is forced to
stay away from commercial real estate (CRE).
“The significance of these declines cannot be
overstated. Our customer base very closely matches the demographics of
the U.S. business population with respect to size and revenue
distribution, which means that these drops in traffic will soon be
reflected in the economic data for US business,” said Steve Van Till,
President & CEO of Brivo, whose user population of over 20 million
credentialed persons generates tens of millions of door access events
per day across more than 50,000 locations worldwide.
The reduction of
occupants in buildings has a direct link to economic activity. While
people are discovering that work-from-home is very feasible, the way we were
rushed into it and the fact that many people are now “home-with-kids”
means that office work has seen a drop in productivity. Many more
people cannot do their jobs from home. While occupancy drops in
entertainment, general health, fitness, and worship underline that
industries that depend on their physical space will face difficult
times ahead and depend on government support.
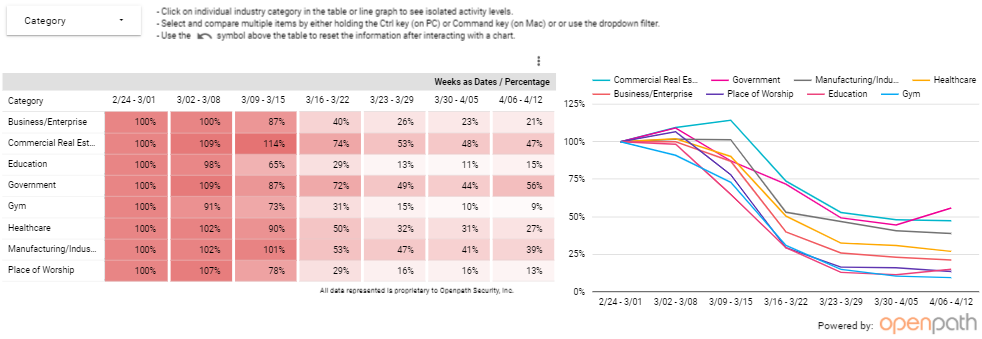
There’s no
doubt that some industries are feeling the effects of the lockdown more
than others, but the occupancy data shows a significant downturn across
all CRE access. The graph below, from access management firm Openpath, shows
that gyms, restaurants, beauty salons, and transportation have seen the
biggest occupancy declines. Along with educational buildings, dominated
by schools that closed according to state policy. Activity in
government buildings, places of worship, and CRE increased in March
before all industries succumbed to the lockdown.
Airports also saw a spike in occupancy
levels at a critical time for the spread of the virus, a potential
source of criticism for the federal government. Major transport hubs
play a critical role in spreading the virus from one city to another.
With more passengers flying into highly-populated, business and
entertainment-focused cities, the chance of an outbreak in those places
becomes much more likely. The result is greater lockdown and
productivity decline in the nation’s business hubs, further deepening
the economic crisis that follows.
“The lack of clarity in the president’s order to
halt entry into the US from Europe – which at first seemed to apply to
US citizens as well as foreign nationals – led to crushing crowds at
airports where unscreened infected passengers could easily transit the
disease to others,” said Anthony Zurcher, North America reporter for
the BBC. “Decisions like those may have had dire consequences,
hampering efforts to contain the spread of the disease throughout the
nation – the public health equivalent of throwing petrol on an already
raging fire.”
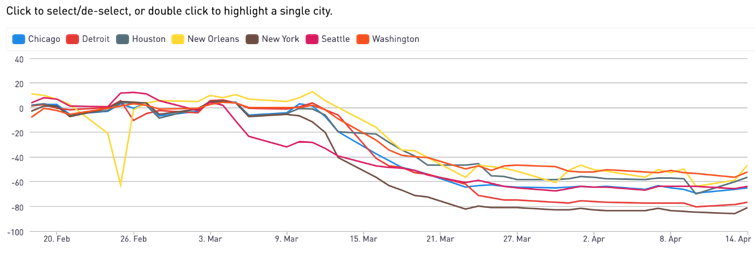
The graph
below from Brivo shows building occupancy levels by city,
highlighting that the largest cities in the US have been hit hardest by
the virus and subsequent lockdowns. With an 80% decrease in CRE
occupancy, NYC tops the list of the most impacted cities urban areas.
Still, many major “business cities” are seeing decreases of more than
50%, raising serious economic concerns.
[an error occurred while processing this directive]“It’s amazing that it’s happening to so
much of the world’s population at the same time. Absolutely,
unprecedented. I have never seen foot traffic drops as we’ve seen over
the last four to six weeks,” Andrew Farah, CEO of people counting
specialists Density, told Memoori in a soon to be published interview.
“We have been conducting some network-wide data research, in the
airline industry, for example, and saw an 85% drop in foot traffic week
over week, even single-digit headcounts in some parts of some airports.
I’ve never seen anything like that.”
It is not until the number of
coronavirus
fatalities rises that the general public will voluntarily lockdown,
compelled to act for the greater good. To avoid reaching those
high-numbers, citizens depend on their government to pre-emptively act
for the greater good. Where that greater good lies in the ongoing
debate between public health and the economy is another question. The
occupancy data provided by our smart buildings is giving us visibility
on what happened, and the same data will also provide visibility for social distancing and cost-saving
measures to help us emerge from this crisis.
footer
[an error occurred while processing this directive]
[Click Banner To Learn More]
[Home Page] [The
Automator] [About] [Subscribe
] [Contact
Us]