Energy monitoring system provides simple, easy to comprehend,
visual tools to identify anomalies.
|
November 2012 |
[an error occurred while processing this directive] |
| Making
Sense of Energy Information Energy monitoring system provides simple, easy to comprehend, visual tools to identify anomalies. |
| Articles |
| Interviews |
| Releases |
| New Products |
| Reviews |
| [an error occurred while processing this directive] |
| Editorial |
| Events |
| Sponsors |
| Site Search |
| Newsletters |
| [an error occurred while processing this directive] |
| Archives |
| Past Issues |
| Home |
| Editors |
| eDucation |
| [an error occurred while processing this directive] |
| Training |
| Links |
| Software |
| Subscribe |
| [an error occurred while processing this directive] |
My office colleague
has an energy monitoring system installed at his
residence. While reviewing daily profiles of the electric loads he was
monitoring at home, he noticed his son’s bedroom load ramp up at around
10 PM and subside by 6 AM. Perhaps his son’s electronic gadgets were to
blame for this peculiar trend! Besides behavioral changes which can be
brought about by using real-time energy information, there are several
ways to monitor, trend and analyze energy information in a commercial
setting which can catalyze effective decision making.
In many fields,
monetizing big data still remains a challenging task to
accomplish. For instance, in spite of petabytes of user data Facebook
still struggles to come up with an effective model to monetize data
amongst the advertising community. Compared to the length and breadth
of user information at Facebook’s disposal, building energy information
is relatively easier to tame and monetize.
I believe that the
building operations team comprising of an energy
manager, property manager, MEP technician, supervisor etc. is the best
judge to determine the energy points to monitor, analyze data and take
appropriate actions to reduce building’s energy footprint. A reduction
in energy use boils down to lower OPEX, lower cap rates and higher
asset values. On a portfolio level, energy information can also help
develop better energy procurement strategies, re-evaluate utility
tariffs, benchmark energy, address retrofit measures etc.
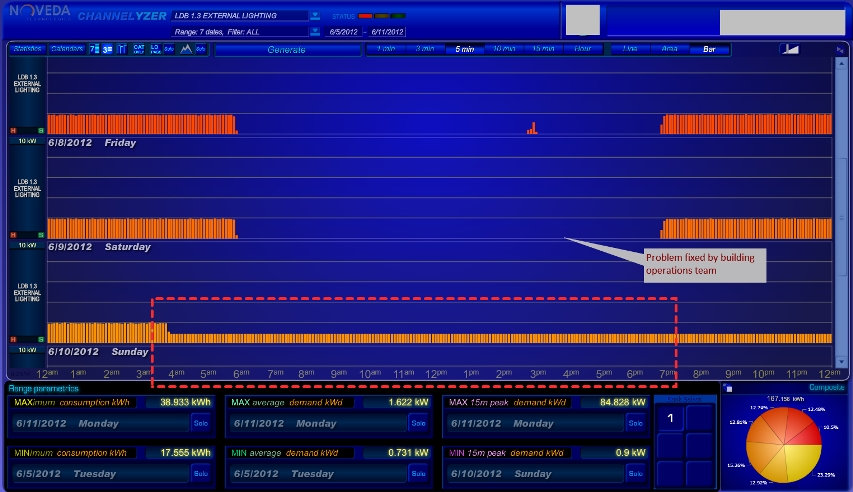
While monitoring
energy, some of the interesting observations made are
listed below. Not only are the cases interesting, but addressing them
led to immediate positive financial impact.
Information is
power, only if we have access to critical information
and know what to be looking for. The building operations team knows
what to
look for, but don’t have a cheap tool at hand to access that piece of
information. Energy monitoring happens to close that missing link.
_________________________
[an error occurred while processing this directive]References
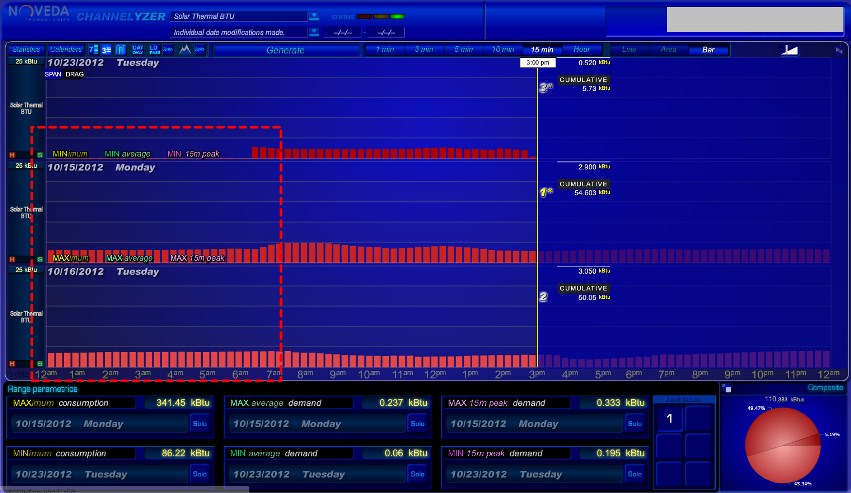
1 The
nuts and bolts of Solar Thermal System are detailed out in Solar
Thermal and Photovoltaic Systems 2007 by Pacific Northwest National
Laboratory and Oak Ridge National Laboratory
2 The
method is detailed further in Energy Information Handbook 2011 –
Application for Energy –Efficient Building Operations, by Berkeley Labs
and United States Department of Energy
About the Author
Abhay Ambati, PMP, CEA, LEED GA - Noveda Technologies
Abhay is a
project
manager with Noveda Technologies. He works with
clients worldwide to deploy and commission a comprehensive data
acquisition system, custom design appropriate energy analytics and
enable them to take effective decisions to forward their sustainability
goals.
Noveda Technologies is an innovative leader in real-time, web-based energy and water monitoring. The company’s patented software solutions help reduce energy and water usage, optimize performance of renewable energy systems, and reduce the carbon footprint for customers across commercial, retail, government, education, and utility sectors. Noveda also offers sustainability communication tools that leverage social media to educate and empower stakeholder communities and make the smart grid a reality today. The company has users in over 33 countries with offices in the US, UK, India and Israel.
[an error occurred while processing this directive]
[Click Banner To Learn More]
[Home Page] [The Automator] [About] [Subscribe ] [Contact Us]