|
April 2013 |
[an error occurred while processing this directive] |
|
Visualization Information can be presented in a variety of ways; it really just depends on what information you want to make available and who the end user is. |
Sarah Erdman, Marketing Director, QA Graphics |
| Articles |
| Interviews |
| Releases |
| New Products |
| Reviews |
| [an error occurred while processing this directive] |
| Editorial |
| Events |
| Sponsors |
| Site Search |
| Newsletters |
| [an error occurred while processing this directive] |
| Archives |
| Past Issues |
| Home |
| Editors |
| eDucation |
| [an error occurred while processing this directive] |
| Training |
| Links |
| Software |
| Subscribe |
| [an error occurred while processing this directive] |
As the building
automation industry evolves, building performance data
and other information continues to become more visual and more
accessible. QA Graphics has been a leader in making building
concepts more visual, from BAS graphics, high-end equipment models and
animations, to energy dashboards. Having provided design
services for the building automation industry for over a decade now,
we’re proud to be at the forefront of these industry changes.
We’re excited to have been asked to present at the 2013 Haystack
Connect later this month, as part of a panel to discuss what we all see
as industry trends for data and visualization.
Graphics and user
interfaces can make a variety of building information available via
desktop, mobile, and other platforms to easily access data, help the
decision process and make day to day functions easier. We aren't
directly involved in managing systems or monitoring
data, but can provide graphics or interfaces that can serve as a
central resource that allow users to access information in way that’s
quick and easy to understand. Information can be presented in a
variety of ways; it really just depends on what information you want to
make available and who the end user is. We had several
discussions about this with folks at the Niagara Summit last May as
well as at the AHR Expo this winter.
A trend that
continues to remain popular, is the use of a dashboard to display
complex building performance data in s simpler format. We help
companies implement our solution, the Energy Efficiency Education
Dashboard®, in order to share building performance feedback in a way
that’s easy to understand. This dashboard is different in that
it’s primarily used for occupant awareness or to provide executive
management with an overview. A feature that we’ve really seen
take off in the last year is organizations comparing this performance
data among different buildings or floors within a building to encourage
occupants to participate in reducing resource use. This type of
solution is also more commonly being used on iPads or tablets in
addition to a touchscreen or kiosk in the building lobby.
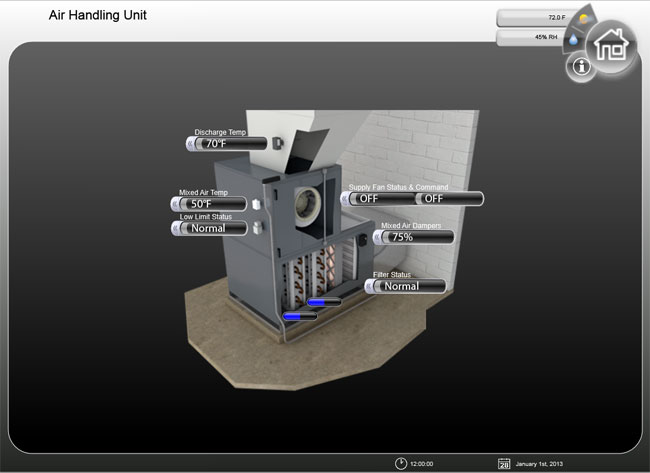
We are also often
asked about 3D graphics and how more realistic graphics can be
utilized. 3D graphics are not limited to any specific
building automation system and are becoming more popular industry
wide. We work on a number of projects where all of the BAS
graphics are required to be photorealistic; clients want the graphics
to accurately represent their campuses, buildings, floor plans or
equipment. This allows them to view an exact duplication of their
building and equipment that is sitting in the mechanical room.
Sometimes it’s requested to provide an interior view of equipment,
which shows how it functions. This can give the operator a better
reference on component locations.
Working with a 3D
environment within your BAS software offers a number of benefits. We
anticipate that user interfaces will increasingly be used in the near
future. An interface can serve as a central resource to view
equipment and access a variety of data. Having a piece of
equipment that can be interacted with on a computer or mobile device
before even seeing the equipment would be a very powerful tool. For
example, operators can pull up a photorealistic image of the equipment
at their computer with the ability to see the equipment from different
angles and review performance data. Onsite, the same
interface could be used on their phone or tablet, to access spec
sheets, take notes and log maintenance data. An interface could
also be used for preventative maintenance, equipment analysis, alarm
notifications, remote monitoring, etc. These types of
graphic solutions and interfaces offer a number of benefits. Not only
do graphics allow information to be presented in a way that’s more
visually appealing and quick to understand. They can help reduce
training times and enhance the user experience.
Realistic equipment representations are only the beginning. A real push needs to be made in the industry to give end users what they really want, the ability to efficiently take over the operations and maintenance of the buildings they paid for. An opportunity exists within the building automation industry to provide end users with an interactive environment of their facility; providing them updated operation and maintenance procedures, real-time views into their equipment, and other important information on all HVAC assets.
[an error occurred while processing this directive]With more and more architects providing building information modeling (BIM) during the design phase of a building, the information needed to effectively hand over a building exists. Why can't this information be made available to the facility's operation staff during commissioning and startup? Why can't this information be integrated into the building automation software? Why can't this be through an interactive 3D environment with real-time and historical data from the BAS? It can, and it should.
We will be further
discussing these trends and more at the Haystack Connect, April 30
during the session titled “Visualization”. The Haystack Connect
will bring together systems integrators, technology suppliers and
customers who are leading the way to more efficient and sustainable
buildings and advanced smart-device applications. This session
will focus on the latest techniques and technologies for bringing
information to operators, owners, and occupants in an always-connected
world. Learn more about the event here at
http://www.haystackconnect.org/.
About QA Graphics
QA Graphics is a leading provider of design services for the building
automation industry, specializing in control system graphics, energy
dashboards, mobile applications, and other user interfaces. Learn more
at http://www.qagraphics.com/.
[an error occurred while processing this directive]
[Click Banner To Learn More]
[Home Page] [The Automator] [About] [Subscribe ] [Contact Us]