 EMAIL INTERVIEW John Petze & Ken
Sinclair
EMAIL INTERVIEW John Petze & Ken
Sinclair |
December 2010 |
[an error occurred while processing this directive] |
| |
EMAIL INTERVIEW John Petze & Ken
Sinclair
John Petze. Former CEO of Tridium joins new software startup focused on analytics.
John
Petze, C.E.M., has over 25 years of experience in building automation,
energy
management and M2M, having served in senior level positions for
manufacturers
of hardware and software products including Andover Controls, Tridium,
and
Cisco Systems. At SkyFoundry (www.skyfoundry.com)
he joins Brian Frank, co-founder and chief
architect of Tridium’s Niagara Framework, as they look to bring the
next
generation of information analytics to the “Internet of Things”.
| Articles |
| Interviews |
| Releases |
| New Products |
| Reviews |
| [an error occurred while processing this directive] |
| Editorial |
| Events |
| Sponsors |
| Site Search |
| Newsletters |
| [an error occurred while processing this directive] |
| Archives |
| Past Issues |
| Home |
| Editors |
| eDucation |
| [an error occurred while processing this directive] |
| Training |
| Links |
| Software |
| Subscribe |
| [an error occurred while processing this directive] |
Sinclair:
Tell us
about SkyFoundry and the concept of analytics?
Sinclair: Is
there a difference between analytics and information dashboards?
Petze: That’s a great question because they are
related yet very different. Here is a way to look at the difference –
dashboards are tools to present information to users – pictures of
equipment
systems, graphs and charts of temperatures or energy consumption, etc.
There is
a lot of progress being made in improved presentation techniques to
make dashboards
more effective, but there is still a lot of data to look at.
Analytics
on the other hand is the process
of determining what data should be
presented. For example do you have time to look through 100
graphics of
equipment systems to see if everything is OK? Do you want to look at
displays
showing the value of hundreds of temperature sensors or be directed to
look at
a display that only shows the temperature readings that are out of
bounds? Or only
the temperatures that have been out of bounds for more than 1 hour? Or
only
temperatures that are out of bounds by more than 2 degrees for more
than one
hour? Analytics adds those additional factors that tell us that
something
really matters and is worth your time.
Those
are fairly simple examples to help to
convey the essence of what we mean by analytics. The next step is to
add
correlation to the analysis process. For example, identify the fact
that
temperatures are out of bounds for more than 15 minutes in certain
zones, and
automatically determine that the reason is that we are in a demand
response
event, which will end in 30 minutes, and tell that to the operator.
That is the
where the real value comes from – giving people the whole picture so
the
operator doesn’t end up going on a wild goose chase simply to determine
that a
condition is “acceptable” based on a combination of factors.
Petze: That’s a question I often
hear. There is a
big difference between alarms and analytics. First of all, alarms
require that
you fully understood what you want to look for at the time you
programmed the
system. For example, did you know that you would participate in a
demand
response program? Did you know that you would not want to create a work
order
to in response to a temperature alarms when the building is
participating in a
DR event if the value is only a bit out of bounds for a short period of
time?
[an error occurred while processing this directive]
Similarly,
in large facilities there are a
lot of interactions between the various systems that simply can’t be
known
until after the building is operational. A key part of analytics is
accepting
the reality that we are going to discover new things over time and
having tools
to do that effectively. Analytics allows you to test new ideas,
identify new
patterns and correlations. It’s about deriving new value from the data
generated by our smart devices.
Sinclair: What
does it look like for the user?
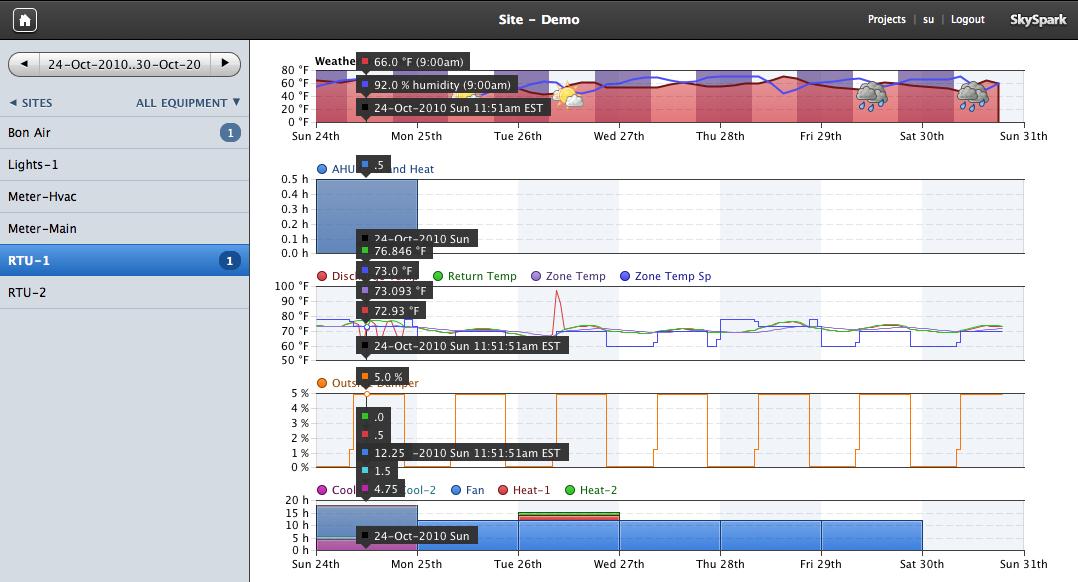
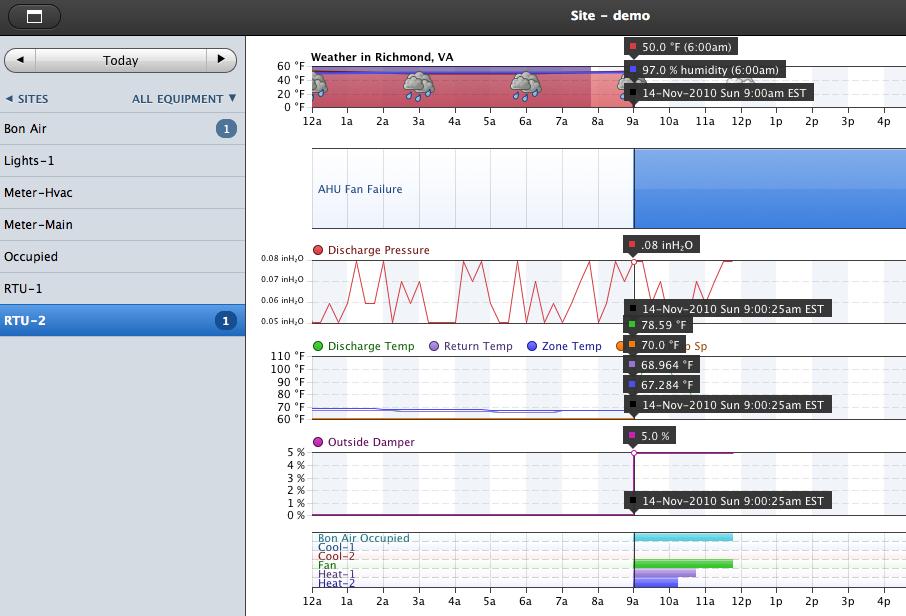
Petze: Here are a few examples of how information
is presented to the user. It all starts when a rule finds a hit –
conditions
that match a set of definitions. When it hits it generates what we call
a
“spark”. The software then automatically assembles information into a
display that
graphically shows the correlation between the “spark” and related data
– for
example, weather conditions, electrical demand, status of associated
control
points, zone temperatures, process variables, occupancy schedules, etc.
So
in essence we’ve created a way to automatically
assess data against a set of rules, and then present the user with the
information that’s related to the issue to show correlations. It’s
really
amazing what you find. It shows you things you never knew were
happening. It’s like
mining your data for money.
[an error occurred while processing this directive]
[Click Banner To Learn More]
[Home Page] [The Automator] [About] [Subscribe ] [Contact Us]