|
December 2013 |
[an error occurred while processing this directive] |
|
Data, Graphics, and Interfaces
Driving Change in 2014
|
| Articles |
| Interviews |
| Releases |
| New Products |
| Reviews |
| [an error occurred while processing this directive] |
| Editorial |
| Events |
| Sponsors |
| Site Search |
| Newsletters |
| [an error occurred while processing this directive] |
| Archives |
| Past Issues |
| Home |
| Editors |
| eDucation |
| [an error occurred while processing this directive] |
| Training |
| Links |
| Software |
| Subscribe |
| [an error occurred while processing this directive] |
As
the year draws to an end, I wanted to take the opportunity to recap on
the trends QA Graphics saw in 2013 and share what’s coming up in
2014. QA Graphics has been involved in the building automation
industry for 10 years, driving the change for more realistic graphics
and interactive solutions. The industry has taken a big leap this year,
embracing high-end graphic solutions, and it will only continue in
2014.
We
participated in a panel at The Haystack Connect back this spring, to
discuss the latest techniques and technologies for bringing information
to operators, owners, and occupants in an always-connected world.
Throughout the year, we’ve had a number of conversations with industry
manufacturers, system integrators, clients and others, and everyone
asks the same question– How can graphics make my job easier?
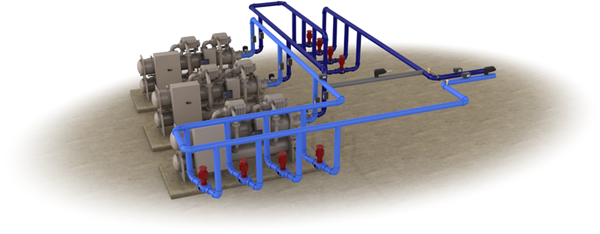
3D Graphics
Manufacturers
are using realistic graphics to better showcase equipment and
demonstrate processes. System integrators and end users continue
to request 3D BAS graphics and floor plans. These graphics are
not limited to any specific BAS. Some of the largest data centers in
the world, federal buildings, hospitals, and universities are requiring
realistic graphics, to have an exact replica of their building or the
equipment that they are working with.
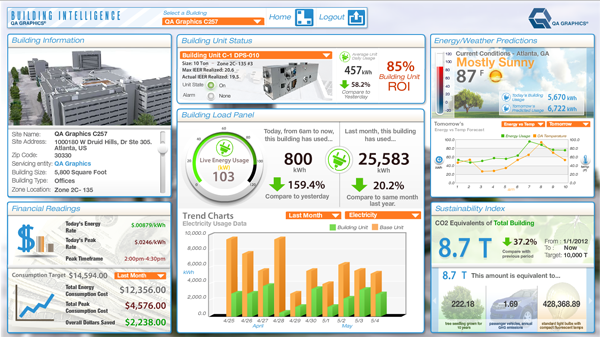
User Interfaces
User
interfaces will increasingly be used in 2014, taking realistic graphics
to the next level and provide a central resource to access data.
A number of businesses have inquired how they can benefit by using
interfaces, so we’ve been developing dashboards and other software to
help businesses access information in a way that’s more visual and more
accessible.
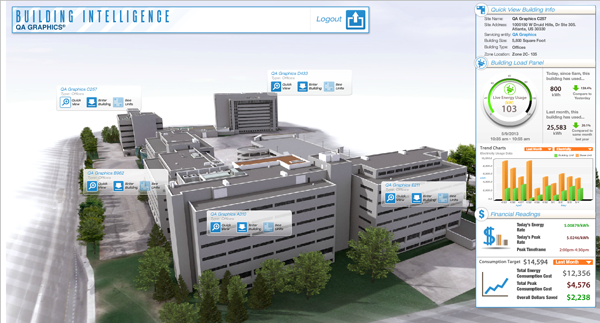
Whether
it’s for occupant awareness, executive dashboards for decision making,
or to display real-time data for equipment performance, user interfaces
can make information available via desktop, mobile, and other
platforms. Not only do interfaces allow information to be
presented in a way that’s more visually appealing, it aids in decision
making, improves operations and maintenance processes, and reduces
training times. Interfaces can be used to access building or equipment
data, spec sheets, equipment analysis, alarm notifications, remote
monitoring, etc. No matter what technology is being used, a user
interface can be created to help make day to day functions easier.
A
large project we took on this past year was creating an executive
dashboard for one of the largest HVAC equipment manufacturers. The goal
was to provide a user interface for their corporate campus, to display
real-time building and equipment performance data for quick views of
building load details, trends on data usage, and other financial
details. For another global equipment manufacturer we are currently
developing an interface which will be used at their manufacturing
plant. The interface will provide real-time details for plant
equipment, detailed 3D animated videos demonstrating equipment
processes, and training videos for maintenance procedures and
troubleshooting tips.
Energy Dashboards
The
Energy Efficiency Education Dashboard continues to be used to create
occupant awareness and in turn earns points for LEED, Green Globes,
CHPS and other green certification programs. The interactive
application makes education and real-time building performance data
available anywhere, anytime, on touchscreens, kiosks, on the web, and
on mobile devices. In 2014 we will be releasing a new platform
that powers these dashboards, which will make it even easier for end
users to make content changes and updates. Also new to 2014 are a
number of educational modules that highlight a building’s sustainable
features.
Stay tuned!
Another
product for collecting building data, the Bridge Data Manager, was
recently released. Bridge is a new standalone data logger that allows
you to collect data from any building source. With benchmarking
ordinances for buildings being put in place, collecting your data now
will help you be prepared for the future. You own and control the
data, and can use it for reporting, commissioning or validating.
This data can also be used on a data dashboard for executive decisions
or occupant awareness.
BAS Graphics
BAS graphics continue to be sourced to companies like ourselves as the use of 3D graphics and floor plans becomes more standard, and as the trend increases to not send projects overseas due to language barriers, time constraints and quality issues. Our technical team is always completing training to develop graphics more efficiently and identify new features to complement graphic services for all building automation systems.
[an error occurred while processing this directive] Johnson Controls, Inc. – We know JCI’s graphic standards inside and out. As one of only two pre-qualified subcontractors with the ability to perform Graphics+ work, QA Graphics completed alpha/beta testing to maintain an understanding of the latest and greatest Metasys features with the GGT 1.3 upgrade. We’ve recently rolled out several new ductwork and template options. The new ductwork serves as an alternative provided within GGT, and is laid out in a 3D perspective view so existing Graphics Plus symbols can be set inside the ductwork image to look more realistic. We’re the go-to when custom or high-end graphic packages are required, to help branches stand out and potentially win more jobs.
Tridium – QA Graphics had developed the symbol library for Tridium’s NiagaraAX 3.7 framework. Because of this experience many integrators look to us for graphic development using the existing symbol set, as well as for custom graphic needs. Another benefit that continues to gain momentum is QA Graphics’ ability to remotely access the NiagaraAX system and the install graphics for clients.
Trane – We’ve partnered with a number of Trane branches to create a unique graphic standard for 3D graphics, equipment and floor plans. We also provide custom templates, homepages and navigational screens. This allows integrators to provide a better product without having to hire additional staff and maintain a consistent standard.
How will you utilize graphics this next year to make your job easier?
As
the industry continues to move into a more visual direction, you can
access graphic solutions that are realistic, interactive, and available
anywhere, anytime. See more examples of how you can do this at
www.qagraphics.com.
About QA Graphics
QA Graphics is an innovative graphic development company specializing
in control system graphics for the building automation industry. The
company is an industry leader in the design of BAS graphic solutions,
energy dashboards, 3D design and animation, and more. QA Graphics
also offers user interface development, sales tools, mobile
applications, videos, and other interactive content. Visit
http://www.qagraphics.com to learn more.
[an error occurred while processing this directive]
[Click Banner To Learn More]
[Home Page] [The Automator] [About] [Subscribe ] [Contact Us]