July 2006
![]()
AutomatedBuildings.com
[an error occurred while processing this directive]
(Click Message to Learn More)
July 2006 |
[an error occurred while processing this directive] |
|
|
|
INTRODUCTION
Automation is creeping into the every aspect of U.S. construction and service industries. Computers are everywhere and robots are coming. The Test and Balance contracting business is not immune to its advancement. Although heavily dependant on manual labor; the judgment, skill, knowledge and analysis needed to put the data collected into meaningful context is significant.
|
|
|
|
|
|
|
|
|
|
|
|
|
|
|
|
|
|
|
|
|
[an error occurred while processing this directive] |
This paper is intended only to highlight the attributes of the measurement technologies discussed for the TAB practitioner, which you may already be familiar with. It will also offer ways design engineers and TAB practitioners can use these instruments to be more effective and successful. Finally, due to the unique character of the instrument at the focal point of this discussion, product attributes cannot be presented in generic terms and product identities cannot be disguised.
BACKGROUND
The single point, hand-held laboratory Pitot or Thermal Anemometer used to perform standardized duct traverse measurements, has been the bread-and-butter means of airflow rate verification by researchers and TAB engineers for many years. It has been the dominant HVAC measurement method used and specified in our industry. The hardware and procedures typically used were the best of alternative methods available for field measurements.
A number of national standards refer to its use as the primary or an equivalent to the prescribed method of measurement, with strict limitations of use, procedure and setup. They include: ASHRAE 41.2-1987, ANSI/ASHRAE 111-1988, ASTM 3464, ISO 3966:1977, ANSI/ASHRAE 51-1999 (AMCA 210-99) and those rating standards that directly reference them, i.e. AMCA 500D / 500L and 610. Add to those the duct measurement procedures adopted and promoted by the AABC, NEBB and TABB.
They all reference as an alternative or focus on Pitot traverse measurements as the primary method to collect duct average velocity data. The inclusion of single-point omni-directional thermal anemometers has helped reduce the average velocity required for fairly reliable point measurements from about 500-700 FPM for a lab Pitot, to about 50-100 FPM for the thermal anemometer. Unfortunately, “manual” is still included in the description of the traverse method and includes not only the collection of data, but transcription, conversions, averaging and report completion.
The manual traverse is a flexible method of measurement and can be used in many airside balancing situations. When performed correctly, within explicitly prescribed conditions and with the proper amount of attention, satisfactory results can be expected. But, how often are TAB technicians given enough time? When will the TAB agency or the facilities operation have enough qualified manpower, especially on larger projects? How often do you have enough space to access a location? When is there sufficient duct length for undisturbed airflow? How often do the duct conditions and layouts completely prevent a manual traverse? How much certainty does your field measurement and the indirect estimating options allowed to you, really provide?
Like other businesses, the TAB contractor must provide a service with justifiable and reasonable results, plus make a profit in order to survive in an increasingly competitive business. The quality of the service provided and reliability of the “product” is just as important as the cost. Prime contractors and owners who hire TAB agencies are many times just looking for the lowest cost. These forces combine to make life for the TAB practitioner very “interesting”.
To make your work performance standout from your competition, to differentiate your company, to complete more projects more profitably, to win a greater share of the projects bid and use fewer man-hours to accomplish the tasks needed; some of your traditional manual operations may need reconsideration.
When equipped with permanent instrumentation at major air distribution points, the potential savings to Owners may provide a source for greater opportunity to the TAB practitioner -- helping to provide you with a cost advantage in bidding over competing contractors who are unable to take advantage of this capability.
Automation may be your option for greater efficiency and predictable consistency, as it has become in so many other businesses. But, how? What technology is available that can outperform a multi-point, independently measured, manual traverse of the duct cross-sectional area?
Permanently installed duct-averaging measurement instruments for airflow have been around for about 40 years. Over that time, the manual traverse performed by your technicians has most likely been the source of the reference accuracy.
In order to help evaluate the potential benefits from permanent instrumentation, even if employed in a system only at strategic locations, we must understand the nature of measurement error, the sources, the meaning of terminology used and the differences in error rates between manual and automatic data collection.
MEASUREMENT ERROR
Error is the difference between a true value and a measured value. However, we do not know the true value of the variable being measured; otherwise we would not take the measurement! Therefore, we estimate the likely upper boundary of an error called the “uncertainty”.
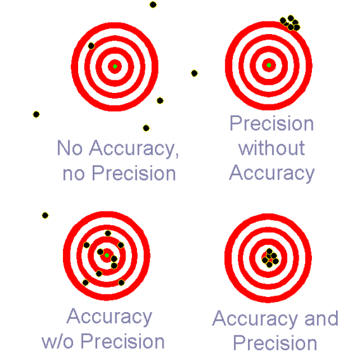
Figure 1. Bias and Precision Error
Precision errors reflect that instrumentation or measurement devices are both imperfect and of finite resolution. For instance, an experimenter may attempt to estimate between the divisions a ruler with scale divisions of 1 mm in an attempt to define distances with an accuracy of 0.1 mm. However, the scale divisions and the human's ability to estimate between them limit the precision. In this situation the human might take a large number of readings and calculate an average and other statistical values (above).
Bias errors are caused by:
Incorrect calibration - a system may give values that err by a fixed percentage (“zero shift”).
Systematic human errors - not synchronizing readings between two technicians.
Defective equipment - incorrect scale graduations, etc.
Loading – dependant relation, a thermistor inserted into an ice water bath might change the temperature of the bath
Keys to confidence in the usage of any instrument for measurement include properties that you should be very familiar with:
Measured numbers cannot be evaluated with “exact” certainty. There will always be some element of error in measurement. There is inherent error in the skill of the person making the measurement. The human eye, for instance, has a limited view. In a view smaller than the eye can handle, a measurement may seem to be minutely different. Thus explains the need for microscopes. Manual processes include human actions. Human actions are inherently imprecise, prone to deviations when repeated.
Permanently installed Pitot arrays or any differential pressure-based measurement devices have inherent strengths and weaknesses. For this discussion we need only to realize that the basis for these measurement technologies are prone to compounding error rates from multiple components required to function as a control input. They are also sensitive to measurement environment and conditions, the optimal conditions for measurement rarely existing outside of a lab. Least in significance, yet very important for many applications is the lower measurement limitation of velocity pressure and the technology’s increasing dependence on optimum measurement conditions, precise data collection procedures, reduction of sampling errors and the quality level of all components used.
This is not sounding like something that can be used with sufficient certainty in the field for acceptable results for a TAB report. The duct-installed Pitot alternative has more problems: they have a tendency to produce significant errors from a lack of periodic maintenance, poorly documented or no recognized reference standard is typically used for set-up or “calibration”, and any scientific basis for placement recommendations is usually questionable or nonexistent – assuming the manufacturer’s recommendations are even followed in practice.
A superior method of measurement for TAB usage should possess all the advantages available from a permanently installed device, none of the disadvantages, minimize any system design limitations or application requirements, reduce or eliminate periodic maintenance and make it as easy as possible for anyone to select, install and use.
Something better than traditional and problematic Pitot array “stations” claiming superior performance is required by TAB if we intend to verify the performance of third-party systems and equipment. What else is available?
[an error occurred while processing this directive] THERMAL DISPERSION VELOCITY MEASUREMENT, A MICROPROCESSOR-BASED TECHNOLOGY
EBTRON, Inc. developed the first microprocessor-based HVAC instrument 20 years ago and for the last 4 years has been manufacturing the 4th generation of products designed using the same basic principles and technology. The latest generation of product provides the greatest amount of both accuracy and precision available in commercial instrumentation for HVAC applications.
The calibrated sensor accuracy is a total uncertainty at the output of < ±2% of Reading (not Full Scale) for velocity, and 0.1o C for temperature. Precision is ±0.25% of Reading. Analog output resolution is less than 1.3 FPM (5,000 FPM scale). Digital outputs are 7 significant digits. Total system accuracy (installed) is published at ±3% to ±10% of Reading for duct average velocity, dependant upon a combination of placement conditions, size (or cross-section) and sensor density.
The manufacturer refers to the technology as “thermal dispersion,” others tend to call this method of velocity measurement “thermal anemometry” or “hot wire.” Any similarity between thermal dispersion and any other thermally-based measurement method exists only in the most generic and generous usage of the terms. Beyond that, they are very different and cannot be equated – in performance or operational advantages, disadvantages, limitations and requirements.
The digital microprocessor is used to compute the actual velocity and to average multiple sensing points, not just to provide the power and memory for scaling or conversions to display, as it is with some manufacturer products. It is essential in minimizing and eliminating the sources of both bias and precision errors in measurement of the cross-sectional average duct velocity and temperature.
THERMISTORS
Modern electronics and the latest microcontrollers allowed the application of bio-medical grade, “glass-in-bead” type thermistors within a highly stable and repeatable measurement system. EBTRON is the world’s single largest user of the thermistor type required to provide the performance and reliability proven in hundreds of thousands of sensors delivered over the past 20 years. The thermistors used by EBTRON are nothing like the inexpensive temperature sensing devices used in wall thermostats (diode case chip thermistors with leads exposed to the environment).
Because each thermistor is hand-made, unique and incapable of being produced with identical characteristics, factory-calibration is essential to identify and record the precise physical changes that are produced under controlled airflow conditions. These unique manufacturing “variations” are effectively eliminated through individual calibration. Design, testing and calibration have also considered a wide operating temperature range (-20 oF to +160 oF). This is why a microprocessor is necessary and why all other (analog) thermistor-based products must either be recalibrated frequently, normally performed with comparison to a poor hand-held reference standard made even less certain under field conditions.
DRIFT
The long-term stability of the thermistors EBTRON uses is assured by the heat treatment provided by the manufacturer. This lack of temperature drift is primarily responsible for their even higher stability when used to measure air velocity. A 10-year drift analysis calculated the total potential contribution to error in velocity measurement due to drift at no more than +0.75% of Reading (worst-case) for the entire system, throughout the entire measurement and operating temperature ranges. As a result of this stability and the permanent storage of the calibration data in non-volatile (FLASH) memory, microprocessor-based thermal dispersion products normally never need to be recalibrated in the field.
Reliability issues and limitations that plagued thermal measurement using analog circuitry have been eliminated. With the adaptation of digital processing, fully automated and 100% QA manufacturing processes, plus, factory calibration to NIST-traceable reference standards, EBTRON has been able to effectively overcome almost ALL of the historical performance and application difficulties that plagued airflow measurement stations in the past.
EBTRON usage by TAB clients provides both TAB agencies and owners with the advantages from continuously verifiable control performance, previously unavailable in HVAC applications. Thermal dispersion technology can provide these advantages because the products can supply:
Low velocity accuracy and sensitivity unequalled for the direct measurement of OA. All EBTRON products are Factory-calibrated to and measure from – Zero (or completely still air). Output resolves measurements to <1.3 FPM increments through 5,000 FPM, without special scaling.
Permanently Calibrated at the factory to reference standards traceable directly to the air speed tunnels at NIST-Gaithersburg. No significant drift over the life of the system.
Virtually Maintenance Free in normal HVAC environments. No pneumatic piping, no orifices to clog, no periodic recalibration, minimal inspection and cleaning recommendations. Light-weight aluminum construction and external insertion mounting allows for simple removal, should no internal access be provided.
Velocity and temperature sensor outputs can be logged for historical documentation. They also provide a detailed analysis of the air system at any point during operation, during balancing activities or commissioning.
Permanently installed stations are equally as useful in CAV as they are in VAV air system designs. Hospitals and labs require that CAV airflow and pressure differentials be maintained constantly, regardless of environmental changes or the system’s operating conditions (e.g. filter loading, wind pressure, stack effects, system effects, etc.).
Owners benefit from the significantly improved air control performance from their digital control systems. Usage will also limit construction and start-up delays due to unreliable measurement technologies and help contractors to beat deadlines by minimizing start-up time, installation labor and overall installed costs. They help get everyone off the job much quicker and with much fewer problems.
Permanent instrumentation provides consistent and continuous base-line performance measurements for system start-up trouble-shooting, energy usage monitoring and operational diagnostics. It also opens the door to energy management and continuous commissioning applications led or utilized by TAB practitioners.
[an error occurred while processing this directive] VELOCITY PRESSURE TECHNOLOGIES (Pitot Arrays)
How are EBTRON and a TAB traverse different from the self-averaging Pitot array flow stations that have been used for more than 30 years?
Unlike Pitot arrays, TAB contractors traverse a duct and record individual readings. Each reading is determined by evaluating the equation V=4005*(∆P) 0.5, where ∆P is measured as inches of H2O. (This generalized relationship does not account for changes in air density due to changes in air temperature and pressure.) The readings are added together and a final average airflow rate is determined. Taking multiple readings throughout the duct can compensate for changes in the velocity profile. Assuming a truly fixed flow rate, a larger sample size will produce a smaller sampling error. The larger numbers also help compensate for errors produced by the sensor, the manual process, manual placement of the probe’s alignment and the time factor between readings. These are some of the reasons for the large sample required by Pitot measurement standards.
Pitot arrays, by definition, “average” the pressure profiles before the velocity is determined. The arithmetic difference between individual methods can result in a significant error in airflow measurement. Manufacturers of Pitot arrays boast high “sensor” densities and suggest that the sensor density of devices using independent sensors is inadequate. To the contrary, Pitot arrays have only a single sensor or sensing element (the pressure transducer), but use multiple pick-up points. Pitot arrays actually have a lower sensor density and suffer worse from placement conditions (sampling error) than ANY device that has more than one independent sensor.
An EBTRON array of sensors provides a true cross-sectional average measurement of both velocity and temperature, needing fewer velocity measurement points than required for accuracy from a velocity pressure traverse in laboratory conditions. The distribution of “pressures” due to a velocity profile is different from and significant to the averaging of velocities. Totally independent velocity sensors at every measurement point provide averaging accuracy in excess of that available with a manual traverse having a significantly greater number of measurement pick-up points, as demonstrated by the US Army Corps of Engineers – Construction Engineering Research Lab in a study published 1985. (Available on request as 1.2 MB PDF file or hard copy).
TECHNOLOGY COMPARISON SUMMARY
Thermal dispersion sensor assemblies are designed to measure more accurately under the turbulent conditions created by up and down stream duct disturbances, as seen in most normal HVAC installations that are never close in comparison to lab measurement conditions.
Disturbances have a dramatic effect on the velocity and pressure profiles in a duct. The velocity profile requires that multiple points be measured to produce an accurate airflow rate average. Permanently mounted devices have fewer systematic and random errors than do hand-measurements in the field and can produce more reliable results with fewer sampling points. Thermal dispersion devices independently determine the airflow rate at each measurement point prior to averaging. Pitot arrays average non-linear velocity pressure signals from multiple pickup points. Averaging errors exceed those of devices using independent sensors, even when the number of pickup points far exceeds that of the number of independent sensors in the comparable device.
Differential pressure-based laboratory Pitot tubes and Pitot arrays require much longer straight duct runs for optimum performance than do thermal dispersion devices. This duct placement advantage is a direct result of having totally independent sensor inputs and a smaller signal-to-noise ratio.
Pitot arrays rely on the physical relationship between differential pressure and velocity. Their calibration factor, K, is generally assumed to be unity (“1”). However, in practice, the calibration factor is rarely equal to 1. The factor is variable, and a function of the Reynolds number, Re, which is expressed as
Re = Vd/v
where V is the velocity, d is the diameter of the Pitot tube, and v is the kinematic viscosity.
Therefore, using a single calibration factor (common for commercial HVAC devices) will result in error in measurement as the airflow rate varies. They are normally “calibrated” in the field and referenced to a duct traverse with hand-held instruments or some other secondary source, using only two or three points to create a curve for the entire range.
In comparison, each thermal dispersion sensor is wind tunnel calibrated at 15 points against reference standards that are regularly verified by NIST, plus Zero for a 16 point curve-fit. Pitot arrays use a single flow coefficient and assume that the calibration factor is unity throughout the entire airflow range.
Nonetheless, Pitot arrays can demonstrate accuracies of ±2% (not including errors from the pressure transducer or any other source), when compared to laboratory test tunnels having very “flat” velocity profiles with sufficiently high Reynolds numbers (i.e. V > 600 - 700 FPM).
Many return ducts (and fan inlets) have significant airflow turndown since the outside airflow rate is generally a constant. In addition, outside air intakes with an airside economizer can also experience significant turndown if a separate, minimum outside air damper is not installed. Therefore, great care should be given to the selection and application of Pitot arrays and transducers.
EBTRON thermal dispersion transmitters use high accuracy A/D converters to measure sensor voltages. All algorithms are processed using floating-point math routines. As a result, the transmitter adds negligible error to the measurement. Pitot tube array performance is significantly influenced by the accuracy of the pressure transducer, which is typically a “percent of full scale”. The square root relationship between velocity and velocity pressure requires extreme caution by the designer when selecting pressure transducer accuracy and span. Useable turndown is limited by the transducer accuracy.
Over the past several decades, the requirement for HVAC airflow measurement has changed. Pitot arrays have dominated the industry since their inception and have influenced the perception of the engineering community about the limitations and reliability of airflow measurement instruments. EBTRON’s thermal dispersion devices provide TAB engineers, contractors, designers and owners with a versatile option for system balancing, commissioning, performance verification and continuous control.
[an error occurred while processing this directive] AUTOMATED AND MANUAL DATA COLLECTION: THE REMOTE DIGITAL TRAVERSE
Every place an EBTRON array is installed eliminates one location that must be manually measured. No holes to drill. The measurement location will not need to be externally man-accessible. The process of measuring dozens of points can be replaced by the data from a permanently calibrated and traceably accurate instrument.
Why should anyone accept the output from one of these units to be at least equal to a multi-point manual traverse? An automated “digital” traverse not only eliminates most of the time required to perform a manual traverse at each location, but also:
Eliminates the time differential between individual point measurements, avoiding the sampling error due to the uncertainty from changes in flow rates and patterns between positions for the next measurement. EBTRON sensors input continuously, once every 60 milliseconds each – effectively “real-time.” Cross-sectional averages are calculated at a frequency of about once every second or less (for the worst-case, largest duct). NOTE: A software revision is expected to improve the sensor sampling rate to about 40-45 milliseconds each.
Provides multiple, simultaneous velocity and temperature measurements eliminating the need to measure temperature conditions across airflows and dampers to check leakage. Supply, Return and Intake measurement outputs for both velocity and temperature (calibrated accuracy is NIST-traceable for both values).
Eliminates the added uncertainty contributed by manual placement and alignment of a Pitot probe or single-point thermal anemometer.
Eliminates the error associated with infrequent calibrations and cleaning.
Eliminates the error associated with analog circuitry drift requiring differential pressure devices to be “zeroed” frequently.
Eliminates the additional errors attributable to manual calculations and transcriptions.
Microprocessor-based electronics dramatically increase the repeatability between any two measurements (to 0.25% of Reading or less), allowing much more realistic expectations for absolute accuracy.
Will possess field reference accuracy greater than available with any portable or hand-held instrument.
Is not subject to the same field placement limitations as other devices, due to its unique sensors, microprocessor-based design and the strength of its factory-calibration methods.
EBTRON recently announced a major development that should be of significant interest to TAB practitioners, TAB engineers and facility managers. EBTRON has made a major revision to the firmware in the current standard Gold Series transmitter PC board. All shipments include the capability to apply an option that will allow a user to instantaneously “beam” the details of velocity and temperature measurements points to any Palm or Pocket PC-based PDA equipped with an infrared communications interface. This effectively provides the user with an “instant” traverse, external to the duct and independent of the ABS system and software. Merely remove the cover of the EBTRON transmitter, point the PDA at the IR emitter and execute the download of data. The PDA software and spreadsheet forms are available for download at no charge at EBTRON.com. The IR emitter is a very inexpensive option at order entry and readily upgradeable to any Gold Series transmitter shipped after January 2005.
Individual velocity and temperature readings has always been available manually on earlier Gold Series units by displaying the values within the “diagnostics mode” at the transmitter. This array of sensor values is now also a data option within the BACnet and Modbus protocols of our RS-485 network-ready models. Each sensor location can now be used to identify specific sensor locations that may have a tendency to freeze faster than others, providing needed advance warning to facilities managers. Now you can program your ABS to automatically avoid winter coil damage from system failures and/or untreated outdoor air based on temperature data trending.
Of possibly greater interest to HVAC designers is another new feature added to the Gold Series transmitters’ firmware – Velocity-Weighted Temperature Averaging. This is the closest you can get to a mass or true mixed air average temperature, accurate to within 0.15 degrees F. With information this accurate and reliable, energy savings efforts should be more easily identified and validated, not to mention operationally more repeatable under varying conditions.
Greater usage of high performing, permanently installed measurement arrays can reduce the time and labor required to gather data or may directly provide sufficient data to satisfy all of TAB reporting requirements. Direct data acquisition may potentially allow for fully automated data gathering and reporting from specific measurement location – but generally will be uneconomical to provide permanent instrumentation for all needed measurement locations. Those generalized TAB requirements listed below are just a starting point for an analysis of the labor savings potential available at projects where EBTRON is installed.
Adjust all main supply and return air ducts to design CFM. [Easier when major operating variables are instrumented to provide continuously repeatable monitoring].
Test and record outdoor, mixed air, and discharge temperatures (DB for heating cycle, DB and WB for cooling cycle). [Wherever positioned, EBTRON provides a true cross-sectional velocity-weighted duct average DB temp with individual sensor accuracy to within 0.1o C].
Test and adjust air handling and distribution systems to provide required or
design air quantities. Air handling Unit Test required data (specified/actual):
Outdoor Intake Airflow
Return Airflow
Relief or Exhaust Airflow
Measure air quantities at air inlets and outlets. [EBTRON currently offers a BACnet-based DDC controller for VAV terminal operation, with integrated multi-point airflow measurement].
Vary total system air quantities by adjustment of fan speeds. Vary branch air quantities by damper regulation. [Eliminates the reasons for all repeat manual duct measurements.]
Provide data sufficient to allow calculations for duct/damper leakage.
Where modulating dampers or economizers are provided, take measurement at full return air, minimum outside air, and 100 percent outside air mode of operation. [With permanent instrumentation, you can take advantage of continuous monitoring, system performance data, simultaneously taken for all significant airflow and air temperature variables].
The provision of high-precision permanent instrumentation for automatic control for new or existing project designs gives the forward-thinking TAB practitioner a competitive advantage.
An example of the data that AABC requires to be collected for VAV terminal units
is listed below. The strikethrough text are eliminated by using
EBTRON and the
grayed-out text is transcription from submittal data. The
highlighted items are
required measurements.
| VAV Fan Terminal Data / Measurements | Method of Collection |
| a) Fan Type | Manually transcribe from submittal data |
| b) Manufacturer / Model. | Manually transcribe from submittal data |
| c) Address number, or identifying DDC unit number | Manually transcribe from submittal data |
| d) Wheel size | Manually transcribe from submittal data |
| e) |
(No longer relevant) |
| f) Minimum / Maximum Design Air Flow | Manually transcribe from submittal data |
| g) Minimum / Maximum Actual Air Flow | Continuous automatic output may be logged to system memory |
| h) |
(No longer relevant) |
| i) |
(No longer relevant) |
Three of four measurements required are no longer relevant with direct velocity measurement. The fourth is data which may be extracted from the ABS data logs or read individually.
The increased accuracy and repeatability of the averaged measurements should have a compounding effect on TAB contract gross profits. Lower bid prices translate to more successful bids. Fewer manual requirements and lowered labor costs means greater margins.
[an error occurred while processing this directive] CONCLUSIONS and RECOMMENDATIONS
With knowledge of the advantages offered by some permanently installed instruments, larger projects can be handled with fewer man-hours. The time saving benefits eliminates repetitive manual measurements for the TAB practitioner. Life-Cycle Cost advantages for the building owner-operator should be obvious. Also apparent should be the on-going advantages and continuous savings available to both the TAB professional and the building owner.
The usage of the output from an EBTRON measurement location should enhance a TAB contractor’s profitability by reducing the total labor cost basis for a project and decrease the average total man-hours “in-the-field.” It will save time, improve consistency, provide documented traceability and quality assurance, improve overall accuracy (reducing combined error rates), provide a more repeatable point of reference for diagnostics and a potential calibration reference for hand-held equipment.
Owners should recognize that an almost insignificant addition to the cost of control instrumentation will provide many times their weight in benefits through the life of the building, make the life of maintenance staff less frenzied, help provide more consistent comfort control and minimize energy usage by KNOWING when changes in ventilation and pressurization performance occur.
Less obvious, but just as important, are the advantages and benefits available to CAV and DOAS designs, especially in lab and hospital systems. Straightforward control and validation issues are clarified with reliable, permanently-installed instrumentation.
Bibliography
AABC. 2002. “AABC National
Standards for Total System Balance 2002, 6th ed.”, Associated Air
Balance
Council. Washington, D.C.
AMCA/ANSI/ASHRAE. 1999. ASHRAE
Standard 51-1999 (AMCA 210-99) --
Laboratory Methods of
Testing Fans for Aerodynamic Performance Rating.
American Society of Heating, Refrigerating
and Air-Conditioning
Engineers, Inc. Atlanta, GA and Air Movement & Control Association
International, Inc., Arlington Heights, IL.
ANSI/ASHRAE.
1988. Standard 111-1988 -- Practices for Measurement, Testing, Adjusting,
and
Balancing of Building Heating, Ventilation, Air-Conditioning, and
Refrigeration Systems.
American Society of Heating, Refrigerating and Air-Conditioning
Engineers, Inc. Atlanta, GA.
ISBN/ISSN: 1041-2336.
ASHRAE.
1992. Standard 41.2-1987 (RA 92) -- Standard Methods for Laboratory Airflow
Measurement.
American Society of Heating, Refrigerating and Air-Conditioning
Engineers, Inc. Atlanta, GA.
ISBN/ISSN: 1041-2336.
ASHRAE. 2005.
2005 ASHRAE Handbook -- Fundamentals. Chapter 14, “Measurement and
Instruments”. pg. 14.15-19.
American Society of Heating, Refrigerating and Air-Conditioning
Engineers, Inc.
Atlanta, GA.
ASTM. 1984.
Standard D 3464-75 Test method for average velocity in a duct using a
thermal
anemometer. American Society for Testing and Materials
International, Inc. West
Conshohocken, PA
Dougan, David
S. 2003. Airflow
Measurement for HVAC Systems – Technology Comparison,
EBTRON, Inc. White Paper, Loris, SC.
ISO. 1977.
ISO Standard 3966:1977. Measurement of fluid flow in closed conduits
-- Velocity
area method using Pitot static tube. International Organization
for Standardization,
Technical committee: ISO/TC 30/SC 5, Geneva, Switzerland.
NEBB. 2005. “Procedural Standards
for Testing Adjusting Balancing of Environmental Systems
(Seventh Edition -
2005)”. National Environmental Balancing Bureau. Gaithersburg, MD, 1998.
Note: Neither ASHRAE nor SMACNA
certify balancing technicians.
Schwenk,
David M. 1998. Air Flow Measurement Accuracy. U.S. Army Corps of
Engineers,
Construction Engineering Research Laboratories (USACERL). Champaign,
IL.
(http://www.hq.usace.army.mil/cemp/e/Et/flow.pdf)
SMACNA. 2002. “HVAC Systems --
Testing, Adjusting & Balancing,” Sheet Metal and Air
Conditioning Contractors'
National Association. Chantilly, VA.
TABB. 2005. “International
Standards for Environmental Systems Balance,” Testing, Adjusting
and Balancing
Bureau, Division of NEMI and associated with SMWIA and SMACNA.
Alexandria, VA.
Visit
http://www.tabbcertified.org for additional information
[an error occurred while processing this directive]
[Click Banner To Learn More]
[Home Page] [The Automator] [About] [Subscribe ] [Contact Us]