Analytics, Alarms, Analysis, Fault
Detection and Diagnostics
Making Sense the
Data-oriented Tools Available to Facility Managers

John Petze,
Partner,
SkyFoundry
|
May 2013 |
[an error occurred while processing this directive] |
| Analytics, Alarms, Analysis, Fault
Detection and Diagnostics |
John Petze, Partner, SkyFoundry |
| Articles |
| Interviews |
| Releases |
| New Products |
| Reviews |
| [an error occurred while processing this directive] |
| Editorial |
| Events |
| Sponsors |
| Site Search |
| Newsletters |
| [an error occurred while processing this directive] |
| Archives |
| Past Issues |
| Home |
| Editors |
| eDucation |
| [an error occurred while processing this directive] |
| Training |
| Links |
| Software |
| Subscribe |
| [an error occurred while processing this directive] |
Using data from smart devices is one of the hottest topics in the
industry, and facility managers are confronted with a wide range of
products and features that can contribute to improved facility
performance. From Alarms to Fault Detection & Diagnosis (FDD),
Analysis Tools, to Automated Analytics, each has their place an offers
specific capabilities and benefits. Systems Integrators and owners,
however, are often faced with a comparison between "apples and oranges"
as they try to evaluate the different tools.
Comparing the technologies with set of criteria can help facility
managers better understand the roles, capabilities and benefits of
these tools so that they can assess the best fit for their needs. Lets
look at the range of tools from the perspective of:
- Time and Location of Implementation (when they are defined and where
they run)
- Data Scope – the range of data items being analyzed
- Time Range of analysis
Alarms
Alarms are one of the fundamental tools that have been available in BAS
systems since the early 1980’s and remain an important tool. Often,
when first introduced to advanced analytic tools people look to make
comparisons with alarms. After all, doesn’t an alarm programmed in a
BAS tell me something is wrong? At a very basic level there is a
similarity but if we look a little bit deeper we see that there are
fundamental differences between alarms and more advanced analytic tools.
First of all, alarms require that you understood what you wanted to
look for at the time you programmed the system. In other words you knew
exactly what you wanted to look for and took the time to program that
specific alarm definition into the system. This is fine for simple
issues like a temperature going outside of a limit. There are many
inter-relationships between equipment systems that may not be known at
the time the control system was installed, however. One of the great
benefits of analytics is that it enables you to find patterns and
issues you weren’t aware of at the outset of a project – providing
results that show how your building systems are really operating vs.
how you thought they were operating.
Given that alarms require that you could define the specific condition
ahead of time, time of implementation is typically during the initial
programming of the control system. This requirement fits a wide range
of conditions that we want to identify in our control systems, but is
also a limiting factor.
Data Scope. Alarms usually evaluate a sensor value vs. a limit. They
may also include a time delay – i.e., the condition must be true for 5
minutes before an alarm is generated. Alarms are most often associated
with a specific point. For example, one of the most common approaches
is to set alarm limits for each individual point when it is configured.
The data scope of alarms is also typically limited to the data in the
local controller or other devices within the control system. Alarms do
not typically evaluate enterprise data or data from other external
sources.
Time Range. Alarms are typically evaluated “now”. By this we mean the
real time condition of the sensor vs the alarm limit. This is a key
point - very different techniques are needed to look back over years of
data to identify conditions patterns and correlations.
Describing What Matters. The next difference to consider is the
flexibility of expressing what you want to find. Alarms don’t typically
allow for sophisticated logic that interrelates multiple data items,
conditions, data sources, etc. For example, an alarm definition might
be: “Is the value of the Room Temp sensor above 76 degrees F right
now?” An analytic evaluation on the other hand might be: “how me all
the times when any room temperature was above 76 degrees in the last
year for more than 5 minutes at a time during occupied hours, and
totalize the number of hours by site.”
Processing Location. Adding new alarms typically means modifying
control logic or parameters in controllers. This means you need to have
access rights to modify the controller logic to change or create
alarms. This can be very limiting if you just want to “find things” in
the data or are trying to analyze data from a system installed and
managed by others.
The need to “reach into the controller” makes alarms “expensive” when
trying to use them as an analysis tool. For example, could we justify
reprogramming controllers in remote 500 sites because we have an idea
of a data relationship we want to look for? Most likely this would be
cost prohibitive. The important point is that there is significant
“friction” involved in using basic alarm techniques for anything beyond
limit-based relationships of individual points.
FDD – Fault Detection & Diagnosis
FDD techniques are typically equipment or device centric and
characterized by pre-defined rules based on an engineering model of a
piece of equipment. For example, FDD rules for a type of Packaged AHU.
Time of implementation. There are two “implementation time” components
to consider with FDD. Generally FDD requires that an engineering model
of the equipment be developed before hand. In this respect they require
significant pre-knowledge of the system. As such, FDD rules are often
not flexible for use on custom, built-up central systems, etc. The fact
that no two buildings are alike can further limit where FDD techniques
can be applied. Because of the dependence on predefined equipment
models FDD is typically not a good fit for ad hoc analysis – e.g., “I
have this idea about a behavior I want to detect”. In addition, FDD
rules can often be developed only by the software/service provider. The
rules are “part of the product” versus being programmable on a project
specific basis.
Processing Location. FDD solutions are typically applied as a separate
software application that pulls data from the BAS system. The software
may be installed locally or hosted in the cloud. Some FFD solutions can
be programmed into BAS controllers. In this case they require
“touching” the control system.
Data Scope. FDD rules are typically focused on the predefined points
associated with a known piece of equipment. They may include data such
as weather, but do not typically encompass external data, like age of
building, historical energy consumption, type of facility, square
footage, type of equipment, etc. or provide the ability to rollup and
correlate data from hundreds of pieces of equipment.
Time Range. FDD rules typically look at real time conditions, but some
have the ability to look at data from a sliding window of time – such
as the last hour or day of operational data. Ad hoc analysis of random
time periods (i.e., last August vs this June) may not be available.
Analysis Tools
Most often discussed in relation to energy meter data, analysis tools
provide an experienced user with the ability to look at data and slice
and dice it with a range of tools to identify peaks, anomalies, and
perform normalization against weather, building size, and other
factors, etc. The most significant characteristic of analysis tools is
that they require a knowledgeable user to be sitting in front of a
screen to interpret that charts and graphs to identify the important
issues – in other words, “wetware” is a key part of the issue
identification process.
Data Scope. Most commercially available analysis tools focus on a
specific type of data and application, for example, energy meter data.
They integrate weather data (degree days as a minimum), occupancy
schedules and building size, but do not integrate the full set of
equipment data such as temperatures, pressures, speeds or rate of
operation, equipment status, etc.
Time Range. From a time perspective, analysis tools provide the ability
to analyze across a wide time range. As for “real time” data they can
typically handle data “up to the last reading” – often a 15 minute
sample. They also support batch loads of historical data from meters,
utility sources etc.
Processing Location. Analysis tools can be applied on top of existing
systems as long as the data is available in some open format. They do
not need to be part of the initial installation and typically do not
require any changes to BAS programming. Analysis software can be hosted
in the cloud or installed on-premise.
Analytics
In many ways, analytics can be thought of as a superset of the other
categories we have described. For example, analytics can be applied to
“real-time” alarming situations and offer the ability to define more
sophisticated alarm conditions to create “enhanced alarming”.
FDD rules that diagnose equipment performance issues are a type of
analytics as well. While most FDD solutions employ pre-written rules
based on known models of equipment, programmable analytic tools enable
experienced engineers to implement rules based on their knowledge –
they are not limited to rules defined by the software provider.
In comparison to the other technologies analytics have the following
characteristics:
Automated processing. An analytics engine continuously processes data
to look for the issues that an experienced engineer would normally look
for manually. This ability to automatically process rules to identify
important patterns and correlations is the hallmark of modern analytics
solutions.
Time of Implementation. Analytic solutions can be implemented
anytime, during initial installation or years after. They do not
require reaching back into the control system to make programming
changes for analysis. They do of course require that data be accessible
(we will talk about data availability in a moment.)
Flexibility to Define Rules for Conditions to be Detected. While a
typical alarm might evaluate a single item against a limit at a single
point in time – analytic rules crunch through large volumes of
time-series historical data to find patterns that are difficult or
impossible to see when looking only at real-time data.
[an error occurred while processing this directive]
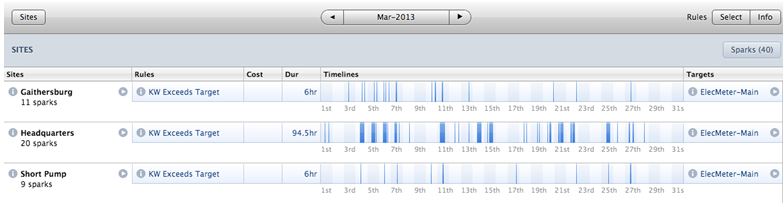
For example, while an alarm might tell us our building is above a
specific KW limit right now, analytics tells us things like how many
hours in the last 6 months did we exceed the electrical demand target?
And how long were each of those periods of time, what time of the day
did they occur and how were those events related to the operation of
specific equipment systems, the weather or building usage patterns.
Analytic rule languages enable sophisticated data transformations
beyond limit checks. Examples include: Rollups across time periods,
calculation of max, min, average, interpolation across missing data
entries, linear regression, correlation of data sets to find patterns
such as intersections (or lack thereof), etc.
One of the key characteristics of analytics is that they expose things
you were not necessarily looking for, or even knew to look for.
Analytic data presentations expose data relationships and correlations
even without writing rules. And systems that offer user programmability
enable new rules to be implemented as findings illuminate actual
operating characteristics, and new priorities emerge due to changing
energy costs, operating requirements or building usage patterns. In
fact, the successful application of analytics is a journey with one
discovery providing insight for additional analytic rules.
A Wide Data Scope. Analytics enable multiple data sets from different
sources, in different formats and with different time sampling
frequencies. They are not limited to data within a controller or a
control system. In many cases the analytic process starts with data
available without establishing live connections to control systems,
meters of other devices.
Processing Location. Analytic tools can be applied on top of existing
systems as long as the data is available in some open format. They
typically do not require changes to the control system and do not need
to be part of the initial installation. Analytic software can be hosted
in the cloud or installed on-premise.
Some Examples Help To Highlight The Distinctions:
An Alarm: Detect zone temperatures above 76 deg F when occupied
An Analytic Rule: Look at signature of data associated with all sensors
to indentify “broken” sensors or sensors out of calibration

Alarm: Detect KW above a specified limit in real time
Analytic rule: Identify periods of time demand is above a specified KW
limit, calculate cost impact, make reports available showing, duration
and even cost across any selected time frame, and provide continuous
real time processing of the rule as new data is received.
An analysis: Generate a graph of energy consumption across a specific
time.
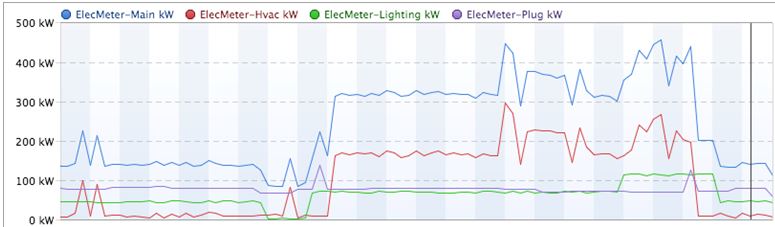
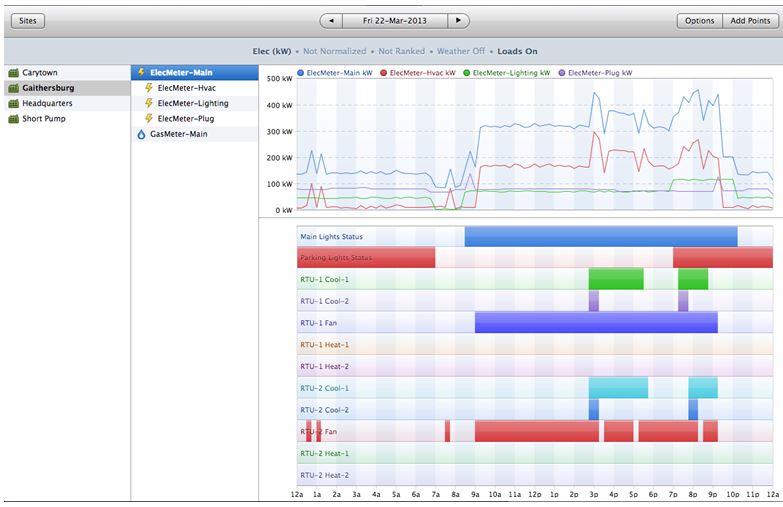
Analytics: Automatically correlate equipment operating status with
energy consumption across a specific period of time.
Can Analytics Effect Control Actions?
Once analytics detects a pattern of interest can the system act on it?
The answer is yes, analytics can be used to issue commands to control
systems, but its important not to overestimate the applicability of
this feature. Many issues found using analytics will not lend
themselves to being corrected with a simple “command” to the control
system. Two quick examples are illustrative:
1. Errors in control strategies. If an analytic rule detects conditions
resulting from defects in a control sequence, the logic will need to be
modified. An example might be simultaneous heating and cooling. While
you could command the heating or cooling off when detected, the
correction of the problem will require actual changes to the control
sequence.
2. Physical equipment issues. If a damper linkage is broken or stuck,
or a valve won’t fully close, or a sensor is out of calibration or not
reading correctly, there is no command to “fix’ these issues.
This doesn’t mean there is no use case for automated response to
analytic results. Two examples of an automated response to analytic
findings are:
1. Automatic generation of more intelligent work orders by the
integration of analytics and CMMS tools.
2. Automated Demand Response. Demand response actions can be executed
in response to energy use patterns detected (or predicted) using
analytics. This provides more intelligence than more simple limit based
demand response control.
Data Access – A Key Requirement For All Data-Oriented Tools
All of these tools are dependent on being able to access relevant data.
Because alarms are processed locally in the control system data access
is not an issue -- the data “is there”. In order to take advantage of
the others tools, however, we need to assess the process to gain access
to the data. A good way to start an assessment is by answering the
following:
1. What data do you have?
Examples: Energy meter data, facility data (size, location, type, year
of construction, etc.), equipment operation data such as on/off status,
sensor data, etc.
2. Where is the data located?
Examples: BAS system, SQL database, utility company website, Excel
spreadsheets, etc.
3. What method will be used to access it?
Examples: Live collection of data via Bacnet or oBix, Haystack, Modbus,
etc., data download from utility website via xml (perhaps Green Button
data), CSV file import, SQL queries processed on a daily, weekly,
hourly or minutely basis. The answers to these questions will vary
dramatically based on characteristics of the specific project and
customers needs.
A Fast Moving Field
None of the examples presented are meant to be absolute, rather they
are offered to help systems integrators and facility managers gain an
understanding of these tools, their requirements and potential
benefits. With the rapid advances in data-oriented facility management
tools, there is overlap between them and the lines blur as vendors
advance their technology.
Another key point to consider is that you don’t have to “do it all” to
get value from data analytics. While you can’t install half of a
chiller, you can start with analytics on a small subset of your data.
Energy data, building occupancy, and weather is a great place to start.
For our part at SkyFoundry, we offer both automated analytics and
analysis tools. Analysis tools are often used to gain insight into
operating characteristics and then rules are written to provide
continuous detection of important issues relating to equipment
operation and energy use.
About the Author
John Petze, C.E.M., is a partner in SkyFoundry, the developers of
SkySpark™, an analytics platform for building, energy and equipment
data. John has over 25 years of experience in building automation,
energy management and M2M, having served in senior level positions for
manufacturers of hardware and software products including Tridium,
Andover Controls, and Cisco Systems. At SkyFoundry he is working to
bring the next generation of information analytics to the “Internet of
Things”.
[an error occurred while processing this directive]
[Click Banner To Learn More]
[Home Page] [The Automator] [About] [Subscribe ] [Contact Us]