October 2009
![]()
AutomatedBuildings.com
[an error occurred while processing this directive]
(Click Message to Learn More)
October 2009 |
[an error occurred while processing this directive] |
|
|
Roy Kok,
|
As the old adage says, if you don’t measure it, you can’t control it. That is the fundamental principle behind Arizona State University’s energy monitoring system. ASU takes it one large step further – they show it off to the world. http://cm.asu.edu/
|
|
|
|
|
|
|
|
|
|
|
|
|
[an error occurred while processing this directive] |
|
|
|
|
|
|
|
|
|
|
|
|
|
|
|
[an error occurred while processing this directive] |
Energy costs are a major factor in Arizona, both in the summer and the winter. ASU is the equivalent of a small city, with a population of 69,000. In our world of Greener Thinking, Universities play an important role in educating the citizens of the future. ASU takes this responsibility very seriously.
ASU has been a long time proponent of Greener Thinking and has taken steps in many areas, from 1.3 Megawatts of Photo Voltaic Panels to generate supplemental AC Power to running their own 7 Megawatt power plant for the generation of Electric Power. In addition, the Tempe Campus runs two Chilled Water Plants to assist in the cooling of their various campus buildings. All this energy use is made visible through the use of ASU’s Energy Information System and a Campus Metabolism website.
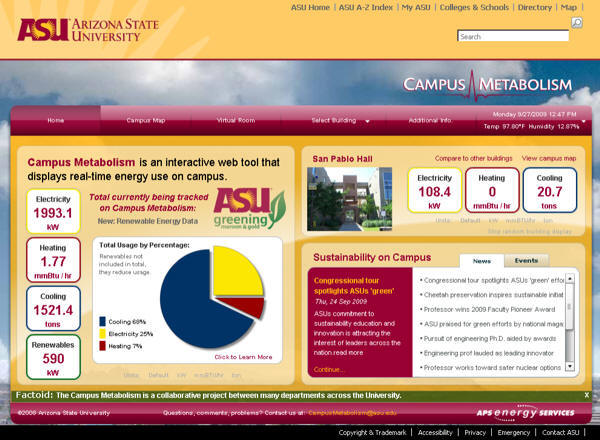
Main Page of the ASU Campus Metabolism Showing Overall Energy Use
In 2004, ASU decided energy accounting needed to be stepped up, and made very visible, to prompt both conservation and education. This required the installation of utility grade instrumentation to properly and accurately monitor a building’s usage. From the gathering of this data, the Energy Information System (EIS) was born.
Today, over 50 campus buildings are being monitored
by the EIS system. This equates to over 1000 variables, but is only about a ˝ of
the overall campus. The process of instrumentation and monitoring has been very
successful and will continue. To date, energy monitoring before, during and
after energy savings programs has proven a 20% reduction and an overall payback
with-in 6-7 years.
In 2007, ASU has taken the success of EIS to the masses with creation of Campus
Metabolism. This flash based web application pulls from the same database as EIS
in order to create an educational environment that not only shows ASU’s
dedication to Energy Savings but creates an environment where students and the
population as a whole can learn how to be more energy conscious.
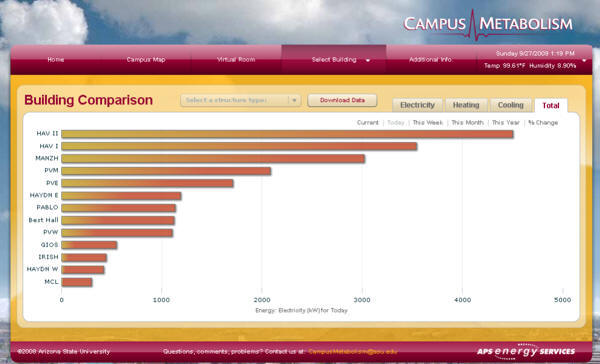
A Comparison Chart Showing Total Energy Use in Buildings
Energy savings have come in many forms, from improved insulation on steam lines, to the installation of more efficient lighting fixtures. Energy savings also come in the form of renewable resources such as Solar. Currently, ASU generates over 1.7 Megawatts of DC electricity through the use of Solar Cells. This Power is directly converted to AC Power, generating 1.3MW, to supplement electricity at peak times of use – daylight hours. In addition, a substantial savings may be had by using electricity during off-peak periods when rates are significantly (up to 40%) less. ASU manages a 5 million gallon Thermal Energy Storage facility where water that is chilled during the night can be used for cooling the next day. Other savings come from the modernization of controls, from old pneumatic systems to today’s DDC (Direct Digital Control).
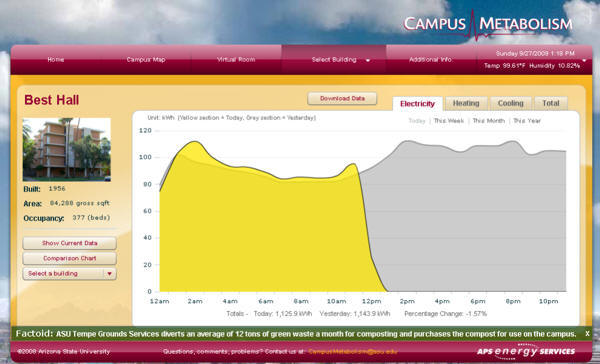
A Chart of One Building Showing Day over Day Energy Use
The project involves more than energy savings in the background. It involves the education of students on campus, making them more aware of their energy use and how they can contribute to savings. To bring the message closer to home, ASU developed the “Virtual Room” demonstrating a living quarters and an office. Complete with Pan, Zoom and the ability to turn various products on and off such as lighting, computers, refrigerators, etc., students have the ability to see and instantly understand the cost per month implications of their actions.
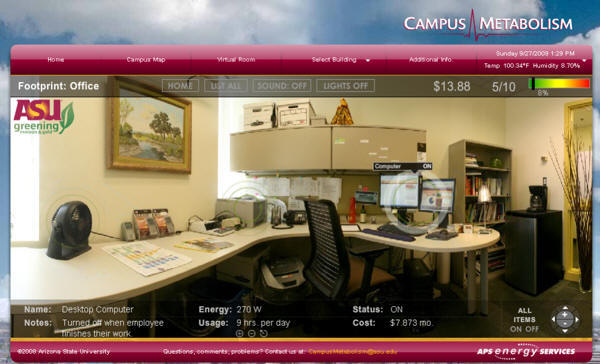
The “Virtual Office” Energy Calculator
Robert Vandling, Senior Technology Support Analyst, responsible for the Building Controls technology and this energy savings program, shared some additional details on the EIS (Energy Information System) architecture. While many protocols are required to talk with all the systems on campus, the most prevalent protocol, used as a common denominator was Modbus Ethernet. However, as they focus more in the intricacies of building operation, BACnet may become equally as important. When first approaching this project, Rob sought the recommendations of several controls experts in order to choose the best communications solution. The recommendation was Kepware’s KEPServerEX communication solution. It delivered one OPC Server able to communicate with a variety of automation protocols. It delivered runtime programming and productivity tools such as import and export that facilitated a quick and accurate scale-up to a full implementation. The proof of a successful selection came easily during a 30 day trial period when, without training, the software was installed and put through its paces without issue. The only area of concern was with regard to using the software on Microsoft’s latest Operating System, Windows Server 2008. This simply required an update from Version 4 of KEPServerEX to Version 5.
[an error occurred while processing this directive] ASU wanted to keep a history of energy use. For this, they turned to Open Automation Software - www.opcsystems.com, and their Microsoft SQL logging product. ASU stores the previous two hours of one minute sampled data, and archives averaged 15 minute sampled data for long term storage.
As one might expect, students play a large role in the implementation of systems. The start of Campus Metabolism in 2007 came with the monitoring of twelve residence halls and one office building. The flash design and data conversions for the website were actually developed by students who are actively participating in ASU’s green efforts. In short, Campus Metabolism, over time, will quickly expand to over 50 buildings and has set the stage for a campus wide rollout.
This project has garnered a great deal of interest from students and visitors alike. It will be featured during a tour by the GREENBUILD International Conference and Expo, November 11-13, 2009. In the latest “Princeton College Review,” ASU was selected as one of the “Greenest” Universities in the “2010 Green Rating Honor Roll.”
For more information regarding the Campus Metabolism
project, please feel free to email ASU at:
CampusMetabolism@asu.edu
[an error occurred while processing this directive]
[Click Banner To Learn More]
[Home Page] [The Automator] [About] [Subscribe ] [Contact Us]