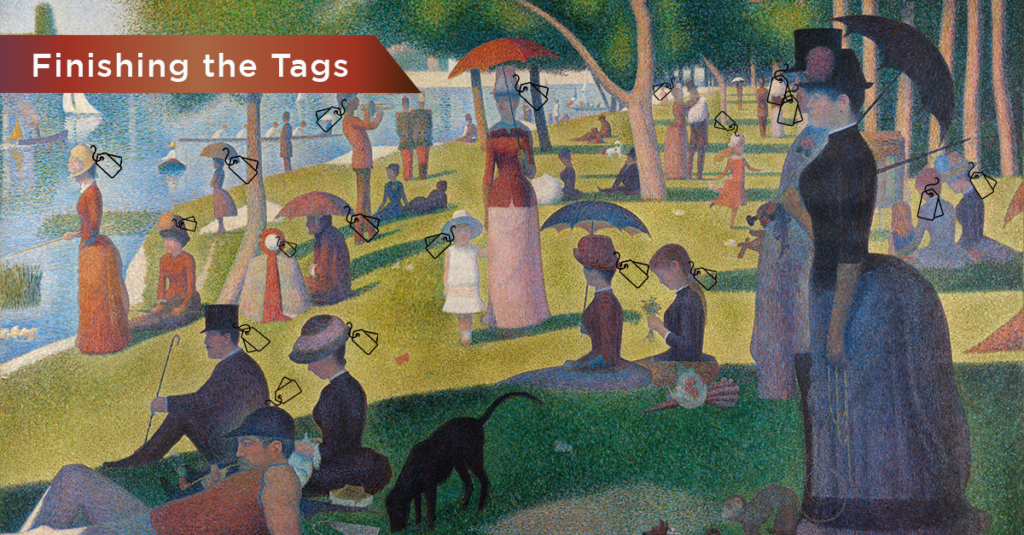
Can you imagine the work Georges Seurat put into all those points? Contemplating the challenge is an opportunity available to any visitor to the Art Institute of Chicago, where Seurat’s “A Sunday on La Grande Jatte” hangs, even Ferris Beuller. Perhaps some of the systems integrators and energy management consultants engaged in semantically tagging control points can relate to Seurat and to Ferris regarding the awesomeness of the challenge. Each point must be tagged correctly for a picture of the performance of the whole building or the whole building portfolio to emerge via data analytics.
The metaphor of comparing the 21st Century semantic-tagging-for-buildings community to 19th Century painters in France is apt. From Malcolm Gladwell’s 2015 book David & Goliath: When the Impressionist painters forged their own path, they ultimately created their own advantages. The building design, construction and operations industries should express a big ‘Hats Off’ to the people that started Project Haystack as well as those working on Brick Schema, RealEstateCore and ASHRAE 223P. Their work is leading to better buildings through data-driven approaches. Along the way, it has kicked off a new cycle of innovation in buildings through software, creating new opportunity for a full range of service providers and software developers in the process.
To connect the dots regarding where we are today along the adoption curve for semantic tagging, this post is going to trace a series of contributing O’s.
O’s for Ontologies and OT Strategies
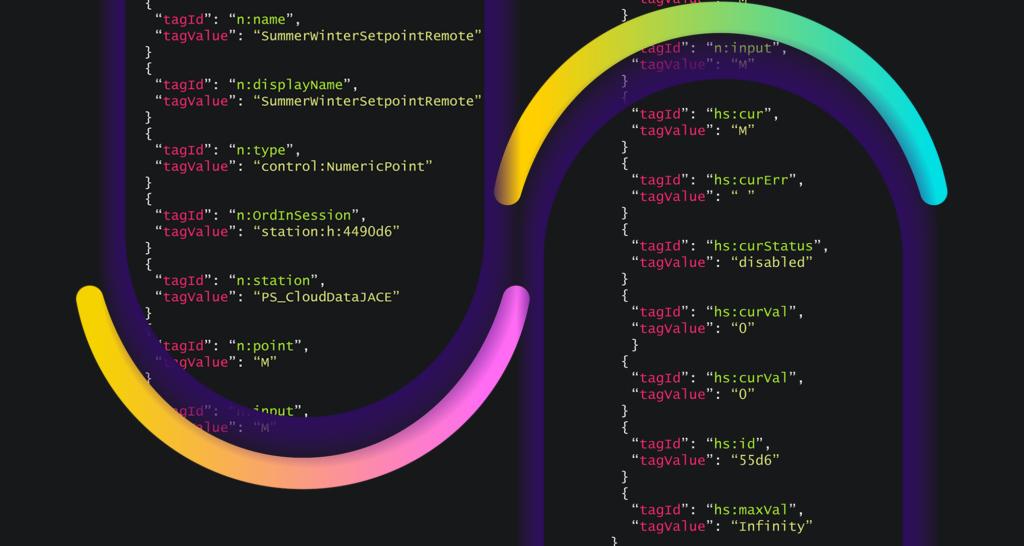
Tagging is a friendly, easy-sounding word, certainly more so than data engineering, data architecting, and data science. But, when you tag, you are in effect engaged in all those things. When you listen to data experts speak about web representations of physical things and processes like air handlers and temperature sensors, they use vocabulary like entities and objects. Entities have basic tags like name and value and type. Entities with basic tags can be organized into dictionaries. A taxonomy organizes types into a hierarchy of classes. An ontology defines how types can interact. While the vocabulary is new to many tasked with the job of tagging points, all one needs to get on with the work is a basic familiarity.
Project Haystack was the first community of taggers to awaken building owners and operators to thinking about their operational data strategy. Currently, the Haystack metadata framework is undergoing modernization as part of a DOE-sponsored semantic modeling project that aims to align it with the other industry-supported tagging methodologies, Brick Schema and ASHRAE 223P. For a deeper dive on what is happening here, read A Comparison of the Brick Schema and Project Haystack by Data Engineer, Erik Paulson. Paulson provides an excellent technical explanation.
O’s for Open Protocol and for Orchestration
In the article linked to above Erik Paulson rhetorically asks, “Where does a Brick or Haystack model come from?” He then answers, “They usually are configured by humans in the BMS, but hopefully that will change in the future to be more automated from other data sources.” (My next post in this series will cover progress in Generative AI approaches.)
Paulson’s hope is shared by many in building operations and maintenance, as well as in design and construction—from those that inherit responsibility for keeping occupants comfortable and safe in existing buildings to those that do the initial commissioning of a new project. Everyone wants a magical way to get past the work of tagging and onto all the benefits of using apps to quickly improve the state of buildings. But his answer concerning today’s reality is also true: if you want to find building projects with good web representations of digital entities in Haystack or Brick methodology, look for places where qualified system integrators applied metadata tags as they went about their work configuring points for a sequence of operation (SOO) in a building management system (BMS).
There has been progress toward a more automated future. Step One was the rejection of the once common practice of locking away operational data in a BMS via proprietary protocols, the keys to which only channel partners of the BMS manufacturer held. On the advice of building data experts (often from the Haystack and Brick communities) building owners are insisting on open-protocol support when they write their BMS specifications. Niagara Framework is the open-protocol BMS platform most often specified by data-savvy project teams that understand their need for middleware to connect to, control, manage, and monitor any device, regardless of manufacturer. Niagara’s system database (SystemDB) exists as an independent data layer by which you can aggregate and normalize data from disparate systems. Niagara’s developers have also built-in tagging support to ease and automate the process of assigning metadata tags. (Read our Tagging whitepapers here and here.)
Niagara’s success in delivering on its open-protocol mission has led to a large and growing global user base. To re-ask and re-answer Erik Paulson’s question “Where does a Brick or Haystack model come from?” Many come from people in the Niagara Community. In turn, market adoption has awakened widespread awareness – especially among software developers – that pre-tagged ‘Niagara data’ is highly valuable telemetry data. A term used by innovative engineers since the 18th Century, telemetry simply means collecting data from one device and sending it to another remote destination for analysis and storage.
O is for Overlay Applications
Developers native to the building controls industry and active in the Niagara Community were among the first to transform or grow independent software vending (ISV) businesses around applications that overlay the Niagara Framework. For the Niagara customer, the fast-growing marketplace of Niagara overlay applications has only spurred more innovation, more choice, and more confidence in the decision to deploy open-protocol Niagara Framework for systems integration and control.
This year, Tridium introduced Niagara Data Service™ and Containerized Niagara to facilitate the movement of contextualized data from a Niagara station into overlay applications in a way that respects its informational and business value. The goal of these new offerings is to further unlock access to telemetry data enriched with tagging. Some innovators who are members of both the Niagara and Project Haystack communities have been pulling contextualized data from Niagara Stations using the nhaystack REST API. Tridium has contributed engineering talent to the development of nhaystack. An nhaystack interface to Niagara Data Service may be offered in the future, such that end-customers have the option of using both APIs in a complementary way. However you stack it, more facility managers, system integrators and energy management service providers will adopt standardized approaches like Brick and Haystack when they feel assured that the investment they make in tagging will be preserved and leveraged by many stakeholders and over a long period of time in a stable, secure, and scalable cloud environment. You could summarize that the two trends enabling large-scale deployment of smart building approaches to fixing the energy waste and human comfort problems of existing building stock are 1) cloud solutions and 2) standardized point tagging.

We are in an exciting, fast-turning cycle of innovation in smart buildings. There are many BMS-overlay application developers bringing new software to market, as previously mentioned. However, a large percentage of start-ups and their products fall prey to the technology Chasm, never making it past the early adopter/engineered-system phase that the Smart Buildings marketplace is in right now. Data ownership can hang in the balance when smart-building technology buyers try out cloud-hosted overlay solutions. While it is a strength to bring onto a project team the semantic tagging expertise of one or more of the high-caliber building analytics software companies that have emerged from tagging communities, owners should still not entrust any one vendor with a blank canvas. If all tagging happens in a cloud-hosted overlay application, that data engineering investment can be lost should the need to switch vendors arise.
Buyers need to think about data ownership from the start of a cloud-based software licensing contract with a BMS overlay software vendor. Innovation is made more accessible when set-up and deployment costs can be rolled into a neat monthly subscription fee that can be pulled from an operating-expenditures budget (OpEx). However, there is a downside to outsourcing data strategy to the SaaS vendor: a cloud vendor lock-in analogous to the BMS proprietary protocol lock-in of the recent past.
O is for Ownership
Any enterprise investing in a smart-building technology should own their operational data strategy, establishing it with a sound understanding of desired short-term and longer-term outcomes. They should establish guidelines for preparing and storing their operational data, down to identifying the standardized tagging methodologies that should be applied. It helps to have an idea of the data formatting needs of the analytics programs that will be deployed—recognizing that these can change.
Smart-building project teams can reduce their technology risk by centralizing the work of data engineering—typically the most expensive, ‘heavy lift’ of the project. Often this means applying tags in the BMS, particularly in a Niagara-based BMS that maintains time-stamped trends complete with tagging and other model data. There are strengths and drawbacks to each of the tagging ontologies available. As Erik Paulson also recommends (see linked article above), a project team should investigate these and set guidelines about which methodology to use.
Next, for most use cases, smart building technology buyers will want to maintain ownership of the valuable data their smart-building investments generate. Today’s Smart Building data exhaust may be tomorrow’s AI-model-training gold! Smart building data ownership needs to be protected because data is an asset, like other forms of intellectual property. It only becomes more valuable as it is enriched with metadata and structured for various applications over time.
P is for Pointillism
Back to Pointillism, Stephen Sondheim was inspired by the same period in art when he composed the 1983 musical Sunday in the Park with George about Georges Seurat. With the song “Finishing the Hat,” Sondheim focused in on how much dedication it takes to realize a vision and create an art that is brand new. This can be said of the Haystack Community, and the collaboration that includes Brick Schema, RealEstateCore, ASHRAE 223P ontologies too. I cannot wait to see where this collaboration and the technology of tagging goes next!
In Part II of this series of posts, I’ll look at semantic tagging and generative AI. Watch for it soon.