November 2007
![]()
AutomatedBuildings.com
[an error occurred while processing this directive]
(Click Message to Learn More)
November 2007 |
[an error occurred while processing this directive] |
|
|
Edward H. Brzezowski, P.E. – LEED AP, |
.Ken Sinclair, the editor of Automated Buildings asked us to share with readers some of our experiences and lessons learned after operating and working from our new shop and office building over the past year and a half.
|
|
|
|
|
|
|
|
|
|
|
|
|
|
|
|
|
|
|
|
|
[an error occurred while processing this directive] |
The “31 Tannery Project”, which serves as our corporate headquarters for over 200 people, continues to evolve and serve as a “living lab” and “hands on” showcase of energy efficiency (EE) and renewable energy (RE) systems. It even became the genesis invention of our own patent pending monitoring / diagnostic and visualization solution (MV) which has proven to be the critical component in achieving the maximum result and greatest return on investment.

We have come to call this the “diet + exercise + personal trainer” approach to create a common metaphor that would easily explain the process and benefits of “energy efficiency (EE) + renewable energy (RE) + monitoring & visualization (MV)”. If your building is “out of shape” then simply “dieting” or adding energy efficiency is a good start. If you add “exercise” or renewable energy to your program you will get dramatically better results. But having a “personal trainer” or, monitoring & visualization solution, who can watch your progress, track your results, motivate you by showing your progress, refocus your efforts when you slip, and tell you what to do next and if you’re doing it right, will provide the greatest results in the shortest period of time.
When the building was first being constructed we embedded more monitoring and control points than a typical building. We did this at the time to be able to look inside and see and learn from system operation and interactions of the energy efficiency and renewable energy systems with a goal of making the invisible, visible. As we learn more, the number of monitoring and control points continues to expand and has become a process of continuing commissioning that has proven to be the critical element to our success that we now plan to utilize for the life of the building.
The major interactive features of the 31 Tannery building include; nine miles radiant heat (80 zones), high performance rooftop units, condensing boiler plant, 223 Kw dc solar photovoltaic system, solar domestic hot water, integrated web-based DDC, and pervasive voice/data/video system with kiosk displays.
On July 12, 2007 we reached an important milestone at 31 Tannery, with our solar photovoltaic system being online for one year. We also documented that for a one year period of time that our building generated more electricity from renewable energy than we consumed from the grid making us the First Net Zero Commercial Electric building in the U.S. – with complete documentation to prove our accomplishment.
For the twelve month period July 2006 to June 2007, our energy usage as recorded by our JCP&L (First Energy) and Public Service Electric & Gas (PSE&G) utility bills, we generated 19,360 KWH more than we used, and consumed 9,806 Therms of natural gas for our 41,508 SF shop and office building. This was accomplished while maintaining the highest level of occupant comfort. During the summer of 2006 heat wave the building was a comfortable 72-74’F while still sending surplus of “green” power back to the grid for other utility customers.
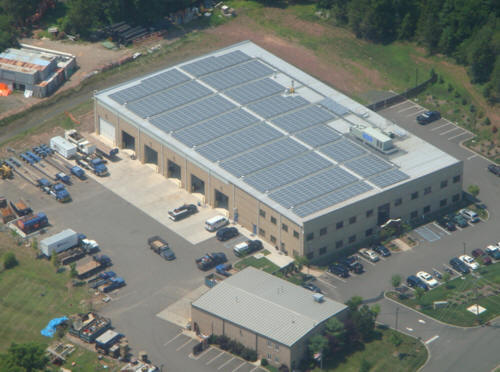
Fig 1. Aerial photo of 31 Tannery, taken on July 31, 2007
Figure 1 shows an aerial photo of our new building. The new building at approx 235’ x 140’ is about nine times the size of the original building next door which uses more energy. The 1,276 solar panels are attached to the standing seam metal roof which was provided with easy access for visitors and service via the rooftop walkway system. All rooftop penetrations and systems were kept to the north side of the building to maximize performance of the rooftop solar photovoltaic array.
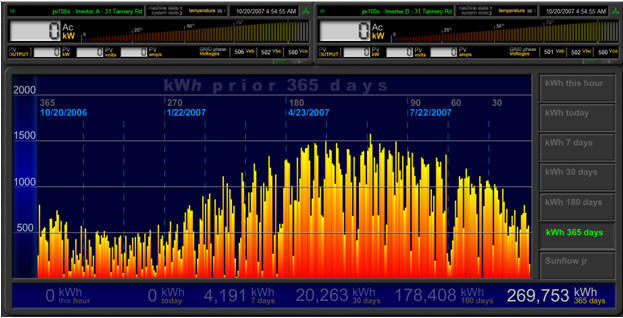
Fig 3. How has the Solar PV performed during the last year?
Figure 3 provide a screen that shows with one click how well the solar photovoltaic array has performed over the last 365 days. The solar PV system has been performing with an output about 10% higher than expected. The graph shows the big drop-off on cloudy and snowy days. The system provides about 500 KWH per day in the winter and 1300 KWH per day in the summer.
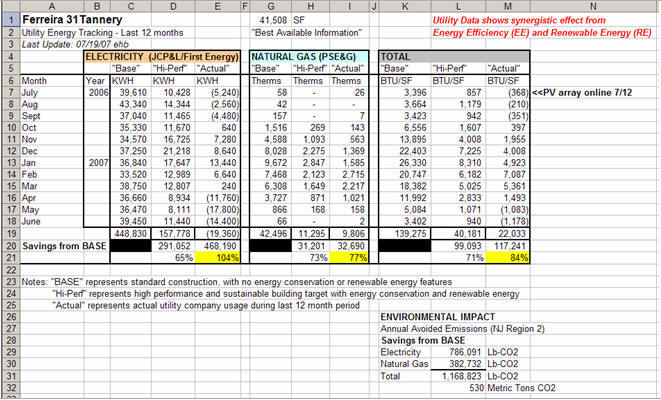
Fig 4. How much energy did we use over the year compared to our goal/target?
Figure 4 is a one year tabulation of electric and gas consumption as well as our BTU/SF. We also compare these readings to DOE 2.1 models for the project that we made before construction when we determined the best fit of energy efficiency and renewable energy systems. The “BASE” model indicates what we would have used for electric and natural gas with typical systems, the “Hi-Perf” model shows what we might expect from the high performance building. The last column “Actual” is from our utility bills.
For this twelve month period of time July 2006 to June 2007, we reduced our electric consumption by 104% from the “Base” and exceeded even the “Hi-Perf” target by more than 100%.
For natural gas we reduced our consumption by 77% from the “Base” and exceeded even “Hi-Perf” target by 13%.
This sustained level of performance was made possible by system integration and interactivity, employee awareness, dedication and feedback as well as our numerous visualization and continuous commissioning displays.
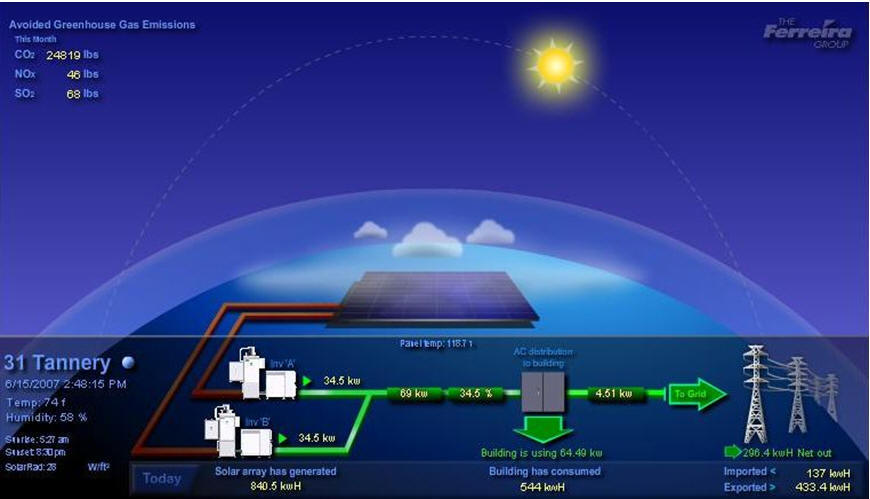
Fig 6. Sunflow Monitor ™ showing avoided Green House gases for the month, electric production, electric consumption, environmental conditions, and more.
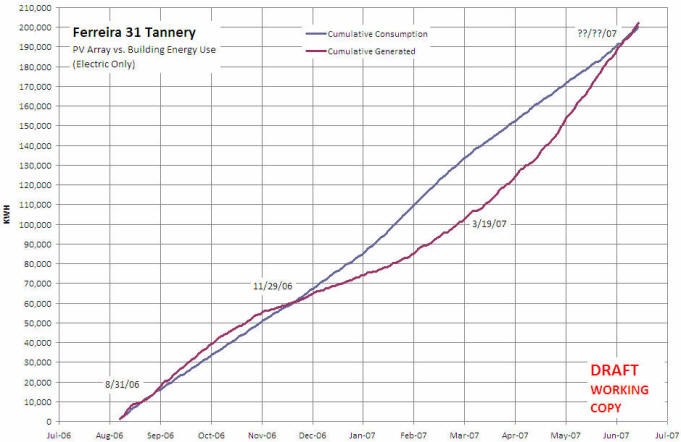
Fig 7. Snapshot: Renewable Energy Generated vs. Building Electrical Energy Consumption (Augie Curve)
Figure 7 shows the results from additional monitoring and control points installed back in August 2006. From the graph we see the operation of the first net-zero electric building on the east coast, with the multiple cross-over’s of energy consumption versus renewable energy. Around Thanksgiving 2006 we start to consume more electrical energy than we generate, by mid March we hit the bottom, and we recovered by June.
The “Lessons-Learned” during design, construction and post occupancy would fill a book (or at least a few more articles….keep tuned). A few of the more interesting are highlighted below:
Grid-tie PV
We have two Ethernet connected Xantrex PV-100S 277/480V 3 phase inverters (100
KWac). We have watched the each inverter operate reliably down to an
unbelievable 2 KW level and up to approx. 112-114 KW. The building typically
goes off the grid by 8A in the morning and back on the grid around 5P. The
surplus electrical energy during the day, offsets the morning and night energy
use as well as on cloudy/snowy days.
We’ve also witnessed and captured “edge of cloud” effect phenomena. We have obtained the highest inverter output readings on partly cloudy days due the increase in solar intensity caused by reflected irradiance from nearby clouds.
We’ve also observed the inverters going offline on sunny days and electricity being used from the grid when we should have been selling back our surplus. This happened during the summer of 2006 when utility voltage levels went +10% to 528-530Vac. During the time while we worked with JCP&L engineering staff the inverters would shut down until normal utility voltage levels returned. This affected the total number of solar renewable energy credits (SRECs) we generate as well as increased our electric consumption from the grid during these periods.
[an error occurred while processing this directive]
Rooftop Units
We have two Trane rooftop units equipped with factory installed “Lon”
controllers. The 50 ton Intellipak unit serves the 15,318SF two story office
area. To maximize the energy efficiency of the building it’s important that this
unit operate properly. Many hours were spent getting this unit to operate
properly in economizer cycle and working in harmony and not fighting with the
radiant heating system.
Solar Thermal Domestic Hot Water
This closed loop solar system has two 80 gallon preheat tanks serving a
80 gallon backup electric hot water heater via a double wall heat exchanger. The
system is reliable and with only two moving parts (i.e. two fractional
circulating pumps). We caught the system one day recirculating from the roof to
the mechanical equipment room without the second pump extracting the heat and
moving it to the preheat tanks. The second pump was “air bound” and corrected.
Condensing Boiler/Radiant Heat
A commercial size radiant heating system is something to see in
operation. In our case it serves a 26,190 shop and 15,318 SF two story office.
We have about 9 miles of in-slab PEX tubing with sixteen manifold headers
serving 146 loops with 80 radiant zones. During installation we embedded
eighteen slab sensors throughout the building. During the coldest days of winter
the highest temperature in the radiant loop is 100’F, most of the time we use
80’F water. An interesting experience is to go to one of the manifold headers on
a 10’F day and place your hand on it, it feels cold to the touch. The best way
we have seen to view the radiant system in operation is using our infrared
camera, we have used this to confirm valve and dynamic operation as well as
viewing/locating the radiant tubes while installing a new modular mezzanine in
our shop for additional space recently.
Utility Metering
The utility company gas and electric meters each have pulse output
signals monitored by our DDC system. This is one of the most important feedback
and visualization tools. In the case of the electric meter, as the building PV
array output approaches the building load the pulse meter slows and then stops.
Additional meters are then needed to determine building load and surplus
electrical energy to the grid during these periods.
We have expanded our efforts to increase energy efficiency and reduce green house gases to include an education program with schools and science museums, we have won several awards, we have seen a dramatic success on creating social and behavioral change with our monitoring system displays, we have found how continuous commissioning can help any building reduce energy cost 5% - 15%, have found new metering and have begun working with commercial, public, and non-profit organizations. But those are stories for another time, maybe next issue….
If you’re a top engineer, building controls specialist, controls programmer or designer who would like to join our team or, if you are a metering, controls, energy efficiency, equipment manufacturer, or other business who would like to discuss a partnering opportunity contact Tony Ferreira directly. If you ask he’ll also tell you what happened with the Department of Energy, the EPA, and Energy Star if you can’t wait for the next issue of Automated Buildings.
Contact:
Noveda Technologies: info@noveda.com
(908) 534-8855 for monitoring & visualization information
Ferreira Group: Tony Ferreira,
fg@ferreiragroup.com, (908) 534-8655 for information on “31 Tannery Project”
or commissioning / construction management services.
About the Author
EDWARD H. BRZEZOWSKI, P.E., LEED A.P.
Mr Brzezowski is a nationally recognized Professional Mechanical Engineer with
30 years of experience. He is currently the Director of Engineering for The
Ferreira Group in Branchburg, NJ where he engineered the first Net Zero Electric
Commercial Building in the United States. This project recently won a 2007 Award
for Excellence from the New Jersey Business and Industry Association. He is the
lead Commissioning Authority Engineer on the new World Trade Center
Transportation Hub project in New York City. Previously Mr. Brzezowski operated
his own private engineering practice and was also a Facilities Director. His
expertise is in Mechanical Engineering, Commissioning, Computer Technologies,
and Building Management Systems. As an inventor, he holds a US Patent for Boiler
Optimization and a Patent Pending for a Building Diagnostic and Commissioning
Application. Mr. Brzezowski has been the recipient of various state and national
awards such as the National Award for Energy Innovation from the US Department
of Energy, the National Award for Contract Engineering and the National Award
for Demand Side Management from Energy User News, Power Sources Manufactures
Association Education Award and the Big “E” Energy Award. Mr. Brzezowski is a
distinguished member of the Editorial Advisory Board for HPAC Engineering
Magazine and is also a contributing author to this and other publications. Mr
Brzezowski is on the Advisory Board for the National Clearinghouse for
Educational Facilities (NCEF). He is a graduate of the New Jersey Institute of
Technology and holds professional engineering licenses in New York and New
Jersey. He is also a LEED® Accredited Professional, a New Jersey Department of
Energy, Technical Analyst, a member of the American Society for Heating,
Refrigerating and Air Conditioning Engineers (ASHRAE) and Building Commissioning
Association (BCxA).
[an error occurred while processing this directive]
[Click Banner To Learn More]
[Home Page] [The Automator] [About] [Subscribe ] [Contact Us]