September 2008
![]()
AutomatedBuildings.com
[an error occurred while processing this directive]
(Click Message to Learn More)
September 2008 |
[an error occurred while processing this directive] |
|
|
Paul Silverthorne, President, |
|
|
|
|
|
|
|
|
|
|
|
|
|
|
|
|
|
|
|
|
|
[an error occurred while processing this directive] |
Introduction
There is a growing understanding that mankind must make change to protect our endangered environment. High on the list of environmental detractors is the impact of energy consumed by buildings. Matt Ransford in an article in Popular Science in March, 2008 stated that ìInefficient buildings and homes account for a third of North Americaís greenhouse gas emissions.î Andrew Winston (author, Green to Gold) sourced material from Architecture 2030 which showed that of the three major carbon producers in the US, buildings lead at 38%, followed by industry at 35% and transportation at 27% (see figure 1 below). Clearly, there is a pressing need to reduce the carbon (energy) impact of buildings.
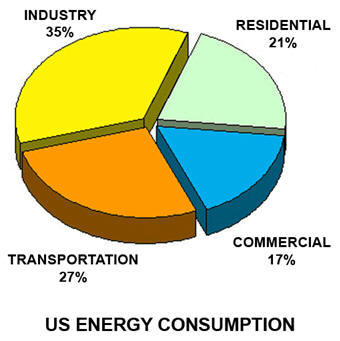
Figure 1 ñ Source ñ www.architecture2030.org
Energy initiatives in buildings have been a common theme for the past 30 years. Historically, most have been justified by cost savings. However, despite the imposition of controls to manage the implemented initiatives, projected savings have often not been realized. We are entering a time when Measurement and Verification tools are becoming critical. Such tools help increase awareness for energy conservation, they notify users when Key Performance Indices are not being met, they identify further opportunities to conserve, they provide validation data for some of todayís complex energy strategies (Demand Response, for example), and they generally help building managers and operators to continuously improve.
Various studies have shown that people who have constant access to utility data naturally conserve simply by changing the way they do things. In a case where individual power meters were installed in apartment buildings in New York City, the tenants, who had to pay for their own usage, reduced consumption on average by 14%. Eric Reguly (Globe and Mail, February, 2008) noted that Dutch homeowners, who had Oxxio meters (Centrica) which transmit hourly data to a client-accessible web site, were saving between 5 and 10% on their electrical bills.
It is clear that measurement and verification pays. Society at large has a growing need to be continuously aware of its utilization of natural resources by buildings, and such tools will become the norm for all of us. These are the tools to help constituents to actively manage their energy portfolio and their use of our precious resources.
Historical Perspective
Measurement and verification is nothing new. Twenty years ago, the term generally referred to a process undertaken by engineering consultants. The US Department of Energy, in its April 2008 release of Version 3.0 M & V Guidelines notes that legislated Measurement and Verification guidelines for Federal Energy Projects date back to the late 1980s and early 1990s. In fact, Version 3.0 is represents an update from Version 2.0 released in 1996 (with interim updates in 2002). ASHRAE Guideline 14-2002, Measurement of Energy and Demand Savings was issued as a reference for calculating energy and demand savings associated with performance contracts. These references indicate that measurement and verification has been around for some time. They also indicate, however, that the principal reason for having these standards was to demonstrate performance in energy usage improvement contracts. They do not indicate that tracking performance was being undertaken in the absence of energy conservation initiatives, or that it was a dynamic (real-time) process.
Over the past 7-8 years, utility companies have taken the initiative to provide measurement data with their invoices. They have included monthly demand and/or consumption data, daily average and year-on-year comparatives to help customers understand how they use resources and what their pattern of usage costs them. While these summaries have increased awareness and have been helpful to consumers, they come after the fact and they have not helped with understanding how energy is consumed over the profile of a day. This type of analysis was historically left to the consulting community to derive.
Current Measurement and Verification Techniques
There is still a significant role to be played by the consulting profession in the procedural preparation of M & V studies. As previously noted, the US DOE has a formal procedure. The Ontario Power Authority in Ontario, Canada has published an Evaluation Framework document (represented in Figure 2) which ìprovides the background for a consistent and systematic method for tracking, reporting and evaluating the impacts and effectiveness of conservation programs funded by the OPAî. These techniques are based on fairly complex procedural processes undertaken by professionals. They are aimed at defining energy conservation techniques, evaluating those that are suitable and then tracking their effectiveness. In other words, the motivation is still primarily operational cost savings.
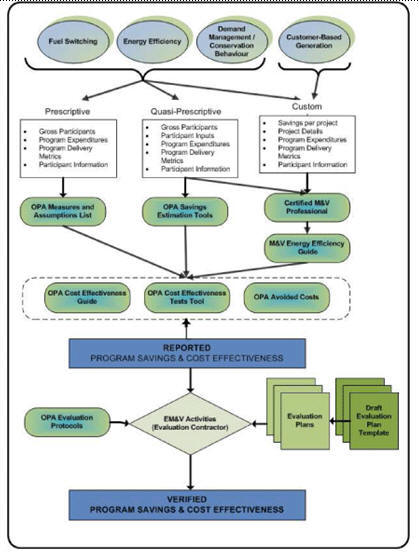
Figure 2 ñ Source ñ www.powerauthroity.on.ca
Apart from the formal procedural processes, there are also other Measurement and Verification tools, utilities and techniques which have arisen as a result of both real-time based energy conservation techniques and the overall desire to know where operations stand at any moment in time. These tools are designed to work with a broader base of resources including water, which is an important conservation issue. In the Summer 2008 edition of ASHRAEís High Performance Buildings, the Editors make the following observation. ìLess understood is that power generation uses 38% of the fresh water in the US, second only to agricultural irrigation at 39%.î So tools to continuously monitor the use of electrical energy and water usage only relate to the particular building, a relationship between improvement in electrical energy usage and the indirect water conservation benefit can be drawn to allow users to see the total water conservation impact of their conservation program. This is an important element of the evolving tools.
[an error occurred while processing this directive] Online M & V Data
There is a growing trend toward the use of ìonlineî measurement and verification techniques. These methods acquire data directly from metering equipment at a site for such things as electricity, gas, and water, to name a few. The data is made available through web portals, which often include the ability to present in real time. These web services are used for both base line data (prior to undertaking any conservation measures) and for ongoing tracking of key performance indices. These ìonlineî approaches include tools for producing model invoices, tracking cost, comparing utility company invoices with computed invoices, analysis tools to help determine conservation opportunities, benchmarking against data available through the Internet, year-to-year comparisons corrected for outdoor conditions, etc. These tools help building managers to ìcontinuously commissionî their buildings, and ultimately, they will allow managers to demonstrate conformance to energy and conservation targets.
Online Measurement and Verification tools are necessary for some conservation and incentive programs. In the case of Demand Response initiatives, it is critical to be able to submit documented proof of performance during a DR event in order to qualify for contracted incentive payments. Programs of this type are accelerating the adoption of such online tools.
One of the natural sources for measurement and verification data is a building automation system. Many buildings have BAS, and such systems capture a significant amount of data which can be used for M & V. The problem has been that the data has frequently remained inside the BAS and has not be available outside for the myriad of application tools available. However, this is changing. There are systems which can acquire M & V data out of a BAS in real time and present it in conjunction with other data available from other buildings, the Internet or other data sources. By way of example, figure 3 shows a power profile acquired from a standard BAS in real time.
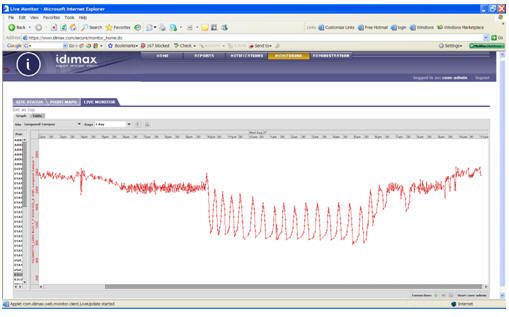
Figure 3 ñ Real-time Electrical Demand Profileñ Dimax Controls
M & V tools are extremely good at presenting patterns. Patterns of usage can be compared to design profiles, past utilization profiles, profiles representative of usage in the particular market sector and so on. These comparisons can be used to trigger notifications. In the case of water, leaks can often be detected before they become a major problem. In the case of electricity, unusual utilization can be detected (in real time) and the appropriate party can automatically be notified. A typical occurrence of this nature is lights left on, for example. Often, patterns reviewed by an expert can speak volumes. Figure 4 shows domestic hot water gas utilization over the period of a week. If the facility to which this pattern related was an office building, then an expert would immediately see an opportunity to conserve since the pattern shows no difference between week days and weekends. To help non-experts, ìvisualizationî tools are continuing to evolve, M & V tools which help managers spot opportunities.
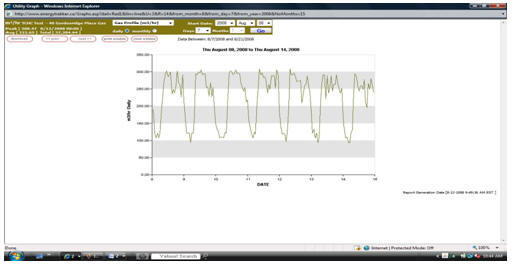
Figure 4 ñ Weekly Gas Utilization Profileñ Dimax Controls
Data can also be acquired from intelligent equipment. Devices such as power meters, variable speed drives, chillers, boilers and other critical HVAC equipment often come with a port from which data can be accessed. Through a combination of data taken from utilities entering the building and data emanating from critical equipment, both performance indices and conservation opportunities can be monitored. Figure 5, for instance, shows water consumption compared with gas utilization in the related domestic hot water boilers. The particular 24 hour real-time plot shows a clear relationship between water consumption and the gas used for domestic hot water. It also shows a spike in domestic water usage without a change in the gas utilization, which was a result of water utilization for irrigation. Having such data helps identify anomalies and opportunities to conserve. Without the data, waste occurs.
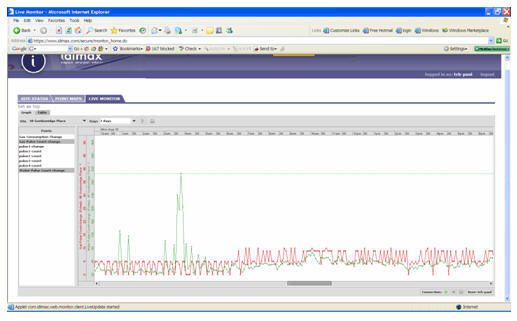
Figure 5 ñ Real Time Plot, Water and DHW Gas utilizationñ Dimax Controls
Conclusion
This article was entitled ìThe Cultural Shift to Measurement and Verificationî. The reason for this title is that, slowly as a society, we are beginning to understand the value of continuous monitoring. More and more we understand that conservation of resources is a continuous need, and we are learning that, with constant input, we can each make a change. We are becoming a society driven to improve our environment, and this drive represents a cultural shift. In his book Giving, Bill Clinton comments on the Clinton Global Initiativeís involvement with the mayor of London with an effort to get the worldís largest cities to work together to combat climate change by becoming more energy efficient. These types of initiatives instigated by world leaders are demonstrating the importance to each of us doing our part for our environment. Measurement and Verification tools and processes will help us, and will drive us to continuously improve.
About the Author
Paul Silverthorne - Paul began his professional career as a consulting engineer, working with two major firms, Giffels Associates and H. H. Angus in Toronto (1968-1973). In 1974, Paul joined Bob Tamblyn and Jim Rose as a founding member of Engineering Interface where he developed several fundamental advances in HVAC, including a thermal storage process (patented by Paul and others at Engineering Interface). In 1978, Paul founded a Building Automation and Control company named Multitrol Corporation, which became Dimax Controls in 1986.
Paul has launched several intriguing and visionary businesses during his career. As well, Paul has published 15 technical papers and he has acted as a specialist consultant in both engineering and business. He has developed and written several significant software packages for accounting, life cycle costing and building performance simulation, and he holds a number of patents and trademarks. He has been the keynote speaker at several international conferences, and taught part time at the School of Architecture at the University of Toronto and in the MBA-LLB program at York Universityís Schulich School of Business.
[an error occurred while processing this directive]
[Click Banner To Learn More]
[Home Page] [The Automator] [About] [Subscribe ] [Contact Us]