|
August 2012 |
[an error occurred while processing this directive] |
| Can Simple Payback Justify
Building Energy Improvements? It may provide some insight into a short-term project’s viability, but when used to analyze a long-term project it will most likely lead to overlooked opportunity which would have resulted in reduced utility costs and an attractive return on investment. |
David
Schurk DES, CEM, LEED AP Houston, Texas davidschurk@yahoo.com |
| Articles |
| Interviews |
| Releases |
| New Products |
| Reviews |
| [an error occurred while processing this directive] |
| Editorial |
| Events |
| Sponsors |
| Site Search |
| Newsletters |
| [an error occurred while processing this directive] |
| Archives |
| Past Issues |
| Home |
| Editors |
| eDucation |
| [an error occurred while processing this directive] |
| Training |
| Links |
| Software |
| Subscribe |
| [an error occurred while processing this directive] |
When deciding whether or not to implement Energy Improvement Opportunities (EIOs), key decision makers may require that some type of economic review be performed to justify any financial investment required. With the decision to select one (or more) EIO based on this review, it is critical that all benefits be properly represented so that the project can be weighed on its true cost effectiveness.
Performing the analysis necessary to help drive an informed decision
can be both complex and time consuming. It may fall into the hands of
personnel who have had little training in performing calculations of
this type. This can result in using the quickest and simplest analysis
method that “spits out” a result, and may be one reason why the Simple
Payback Period (SPP) is so often used. The simple payback period is the
easiest method of economic analysis as shown here:
SPP= Project Cost ($) / Annual Savings ($/year)
To determine the SPP for a project you add up all the individual costs
and savings for the project each year and then divide the total cost by
the total savings. This can show how quickly an opportunity will
“pay-back” on the initial investment however it does not consider the
time value of money nor the benefits from the investment following the
payback period. This limitation means the SPP tends to favor
shorter-lived projects, a bias that is often economically unjustified.
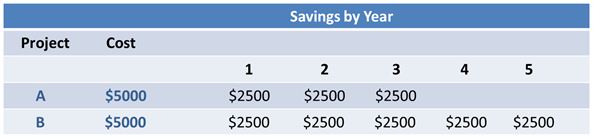
Consider the two projects detailed below:
SPP = $5,000/$2,500 = 2 years
Each project has a simple payback period of two years, but project “B” continues to provide savings of $2,500/year for three years beyond the SPP of two years, while project “A” only provides savings for one year past the two year SPP period. The SPP method ignores critical information, such as the expected life of the project and the value to any savings after the end of the simple payback period. (1)
When the SPP for an energy improvement project is calculated to be between 2-3 years most companies will consider implementing it. A review of the various energy conservation measures shown in Table 1 include several which would deserve consideration based on this requirement, but by applying a strict payback criterion (e.g., all projects must have a payback of 2 years or less) are opportunities overlooked that could easily generate an attractive financial return?
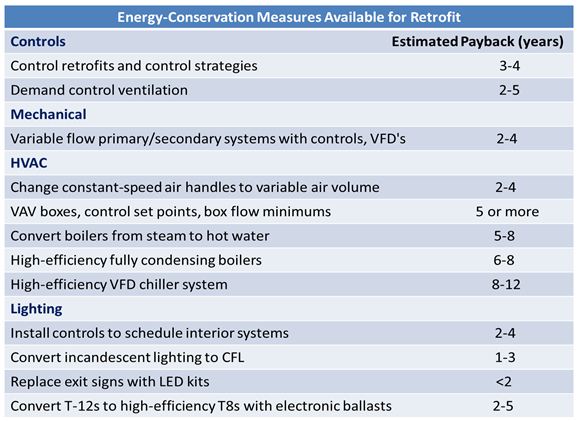
Table 1: United States Building Energy Efficiency Retrofits: Market Sizing and Financial Models 2012
SPP ignores cash flows that occur past the point of capital recovery
therefore should not be used on projects with extended life
expectancies (greater than 2 years).Today’s building automation
technology evolves quickly, but it still may take from ten to twelve
years after installation before an upgrade or replacement may be
warranted.
ASHRAE has published information which lists the life expectancy for
various types of HVAC equipment, ranging from between fifteen and
thirty years. This helps validate the concept that HVAC “systems” are
not short-term investments and consequently the financial benefits
derived from these EIOs can be better judged using a metric other than
SPP.
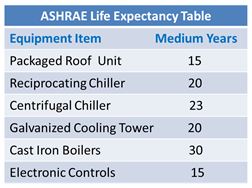
Table 2: Excerpts from ASHRAE Service Life Expectancy Table
An analysis method that is used to base a project decision on the (IRR)
Internal Rate of Return* can define the interest rate or discount
rate that makes the present value of the implementation costs equal to
the present value of any project benefits. If the project earns more
than it costs to finance, it creates economic value. The internal rate
of return measures the result in percentage terms (in the form of an
interest rate)(2). The table below shows what occurs when we take a
simple payback period and calculate the projects IRR to include its
lifespan.
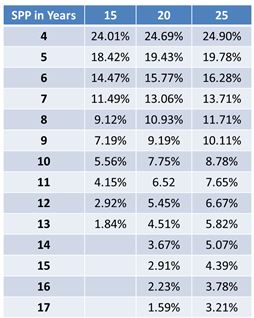
Table 3: Internal Rate of Return for Project Life of 15-20-25 yrs.
For example, a 7-year simple payback translates to an approximate 13%
internal rate of return (for a project with a 20-year life) if cash
flow is relatively consistent throughout the project.
The (MARR) Minimum Attractive Rate of Return (aka ”Hurdle Rate”) is the
term used which defines the “interest rate” that a company considers
acceptable, typically used to evaluate investments in new product lines
or new facilities. MARR can be company specific, often supplied by the
accounting department or from the corporate management level.
An attractive EIO could be one which provides an owner with a rate of
return equal to (or better) than that available through “other”
investment options. This makes it important to have knowledge of what
these other options are (and what they are capable of returning) in
order to compare them to any EIO’s being considered. If MARR has
been established based on exceeding net profit margins, knowledge of
the company’s profitability will help determine if the EIO will
be considered attractive or not. To give a broad view of the
spectrum of profit margins for U.S. manufacturing sectors, Table 4
lists after-tax profit margins (net margins) on sales as reported for
various industries.
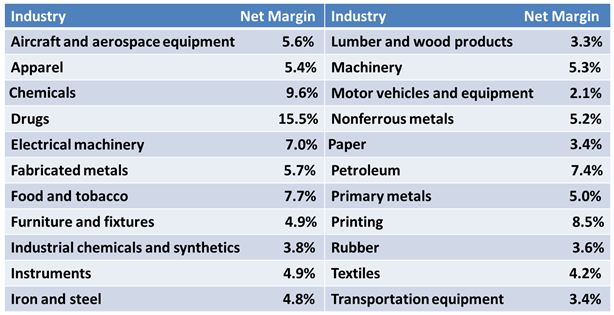
Table 4: U.S. Bureau of the Census, 1998.
By calculating the
IRRs that result through long-term EIO investments,
it can be noted there are many which provide returns exceeding the net
profit margin for many U.S. industry sectors (Table 4). For example, if
a textiles business has determined they will consider investments which
return 2% above their after-tax net profit margin (4.2%) they may be
willing to accept an EIO with a lifespan of 20 years and an IRR
of 6.52% (Table 3). In this case, the projects eleven year simple
payback has no real relevance in the company’s desire to return an
established MARR. Had the company instead insisted on a 2-3 year SPP
they would have overlooked an opportunity which could have met their
financial expectations.
[an error occurred while processing this directive]
Most companies have established the return they expect from their
financial investments. Armed with an understanding of these
expectations, along with the ability to analyze the economics of
various opportunities, a platform can be created from where EIOs can be
viewed by a company right alongside other investment options. Being
able to effectively communicate with key decision makers the benefits
an EIO offers when compared to a traditional investment can make the
difference between a project being shelved versus one which is slated
for implementation.
Can Simple Payback justify building energy improvement opportunities?
It may provide some insight into a short-term project’s viability, but
when used to analyze a long-term project it will most likely lead to
overlooked opportunity which would have resulted in reduced utility
costs and an attractive return on investment.
* Internal Rate of Return is only one of many analysis alternatives
used to determine the feasibility of various investment opportunities.
While not perfect, many financial decision makers use IRR when
evaluating capital projects, therefore it is a metric they may find
easy to understand. When faced with mutually exclusive projects
(projects in which multiple options exist, but only one can be chosen)
the Net Present Value method may be preferable (2). Future articles
will cover this subject in more detail.
References:
About the Author
David Schurk is a Licensed Designer of Engineering Systems, Certified
Energy Manager and LEED AP. He has more than 30-years of
energy-efficiency experience and can be reached at 920-530-7677 or
davidschurk@yahoo.com
[an error occurred while processing this directive]
[Click Banner To Learn More]
[Home Page] [The Automator] [About] [Subscribe ] [Contact Us]