A DVR Approach To Historical Data Analysis
The Data DVR / HVAC Time Machine

|
June 2012 |
[an error occurred while processing this directive] |
A DVR Approach To Historical Data Analysis The Data DVR / HVAC Time Machine |
|
| Articles |
| Interviews |
| Releases |
| New Products |
| Reviews |
| [an error occurred while processing this directive] |
| Editorial |
| Events |
| Sponsors |
| Site Search |
| Newsletters |
| [an error occurred while processing this directive] |
| Archives |
| Past Issues |
| Home |
| Editors |
| eDucation |
| [an error occurred while processing this directive] |
| Training |
| Links |
| Software |
| Subscribe |
| [an error occurred while processing this directive] |
You have a DVR for your television programs which gives you the
capability to watch something later if you were not available to see
the program in real time. It also gives you the ability to rewind and
fast-forward to the interesting parts, skipping over all content that
is insignificant to you. Well now, with the inherent functionality of
DGLux, you are able to reap the same benefits with your building
automation systems.
Historical data, typically analyzed by looking at spreadsheets or
charts, can hide trends and the relationship of the values if not
placed into context. By relating all of your real-time points and
historical data for those points in a graphic timeline you can easily
capture the big picture and derive actionable knowledge.
Furthermore, the traditional approach of having an operator look at
graphical screens in real time to see what is happening is a thing of
the past. Companies today have neither the staff nor the budget
to afford to have an operator look at screens in real time. Today,
graphical representations of data are used to investigate issues.
The DVR concept allows building operators to visualize data as they did
with a real time display, but with the ability to play it back when
needed. This combines the familiarity of the operator interface
with the freedom to view it on-demand and avoids having to have an
operator dedicated to watching the display.
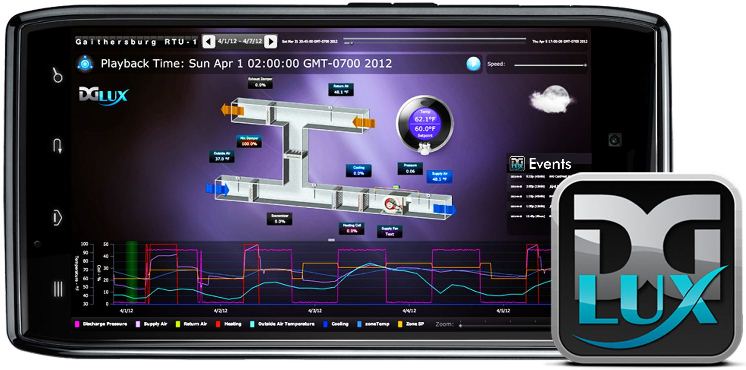
With this “DVR” type of functionality, you can select any date range
that you want to analyze, for example last week, and play back
real-time events as they have happened. By combining a trend timeline
with high-end, real-time visualization, it is easy to understand your
system relationships through visual representations to quickly see
whenever an anomaly occurs and why it occurs. To zero in on the exact
event that occurred, understand why, and plan for future prevention,
you can easily fast-forward or rewind the time frame to see precisely
what happened with your equipment. With this feature, analyzing a
week’s worth of real-time data now only takes you a few minutes.
[an error occurred while processing this directive]
Environmental Systems, Inc. based in Brookfield, WI, earlier this year,
was the first company to take advantage of this functionality by
creating a DVR for an AHU, which allows the user to look at historical
data in more context than ever before. ESI also built this playback
functionality into organizing and analyzing energy data for multiple
buildings, allowing users to see how their buildings perform against
one another over time. This inherent functionality is available across
all versions of DGLux. By setting up rules to find issues, patterns,
and faults, DGLux instantly displays the most important time frames of
your data in your “Events” panel which you can think of as recorded
shows on your DVR box. By saving your “Events” through rules that run
against your collected data, you can immediately identify issues with
your system performance. By clicking on one of these “Events,” DGLux
will instantly redirect you to the precise time frame where your issue
occurred and display the systems involved. This revolutionary approach
to graphical user interfaces provides for an enhanced return on
investment by eliminating the need for a person to sit and monitor
building systems in real-time but rather enable that person to get
notified of an issue and go back in time as if he was really there.
This DVR timeline approach with an air handler unit is a simple example of how you can extract exactly what you need to know about the performance of your systems through intuitive visualization. This approach to historic data analysis can be applied to your zone temperatures and lighting using a floor plan overview or any other piece of your building automation systems equipment to truly understand how your buildings are behaving even when you are not looking. With the ability to clearly understand the relationships and trends of your data from this innovative DVR approach to data analysis, you will be able to derive the actionable knowledge needed to enhance building performance and efficiency.
The link to our video displaying the functionality of the Data DVR https://vimeo.com/38150426
About DGLogik, Inc.
DGLogik, Inc. is a technology company providing cutting edge software
and methodologies for enhancing building performance intelligence
through intuitive data visualization. To learn more, visit http://www.dglogik.com
About ESI
Environmental Systems, Inc. designs, installs, manages and supports
integrated, performance-building solutions for commercial and
industrial facilities of all sizes and types. To learn more, visit http://www.thinkesi.com
[an error occurred while processing this directive]
[Click Banner To Learn More]
[Home Page] [The Automator] [About] [Subscribe ] [Contact Us]