March 2011 |
[an error occurred while processing this directive] |
|
Graphics Demonstrate What the Eye Can’t See
Great graphics offer the opportunity to explain the invisible, allowing you to see what’s going on behind the scenes. |
Sarah Erdman,
|
With today’s technologies, creative graphics can
bring any intangible concept to life to accurately illustrate what
generally can’t be seen. Great graphics offer the opportunity to
explain the invisible, allowing you to see what’s going on behind the
scenes. Graphics can improve sales and marketing tools, simplify
training and education resources, and make technical concepts easier to
understand. Ideas can be brought to reality, demonstrating even
the smallest of details. Graphics are also relied on for day-to-day
building operations, providing you with quick feedback for monitoring
equipment functions, alarm statuses, resource consumption and other
building operation tasks.
| Articles |
| Interviews |
| Releases |
| New Products |
| Reviews |
| [an error occurred while processing this directive] |
| Editorial |
| Events |
| Sponsors |
| Site Search |
| Newsletters |
| [an error occurred while processing this directive] |
| Archives |
| Past Issues |
| Home |
| Editors |
| eDucation |
| [an error occurred while processing this directive] |
| Training |
| Links |
| Software |
| Subscribe |
| [an error occurred while processing this directive] |
QA Graphics is an industry resource that can help bring difficult
concepts to life with eye-catching graphics. The company specializes in
creative design solutions that accurately illustrate building
automation systems, mechanical equipment and sustainable building
concepts. With a design team comprised of technical and creative
backgrounds, ranging from mechanical engineers, graphic designers, 3D
designers, architects, and developers, they have the technical
knowledge and familiarity with building concepts that is required to
accurately meet industry specific design needs.
Seeing is believing. Below are just a few ways that
demonstrate how graphics are currently being used in the industry to
illustrate typically invisible concepts.
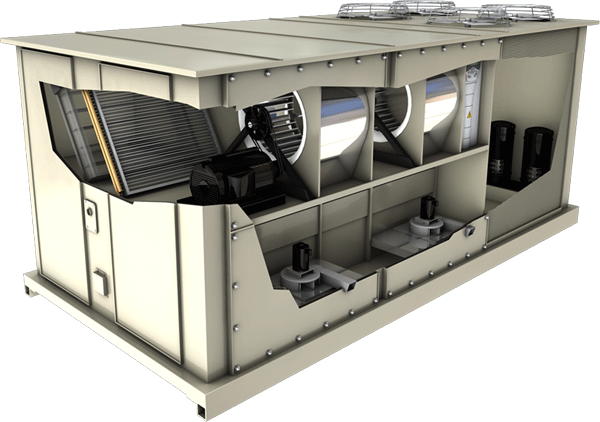
Photorealistic Equipment Graphics
Graphics are utilized in a number of facility management processes to
provide better visualization and ease the day-to-day operations.
Cutouts of mechanical equipment demonstrate what’s happening on the
inside of the equipment. For example, a realistic cutout such as this
rooftop unit shows how the dampers, cooling coil, compressors and fans
operate together. This can be integrated with a facility’s control
system graphics, allowing managers to access critical operation data
including temperatures, fan speeds, whether compressors are on/off, and
alarms for air pressure or pipe temperatures.
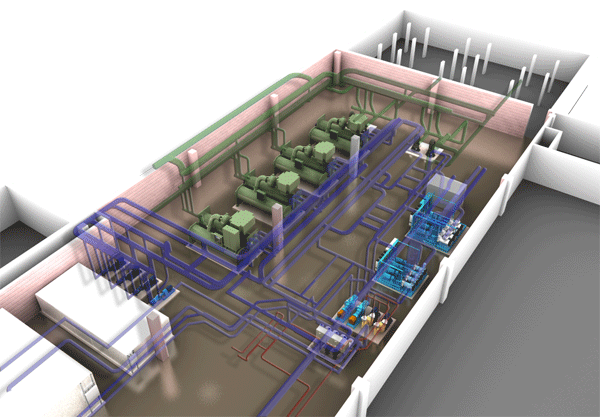
For larger facilities, an interactive 3D campus map can illustrate
multiple buildings, which users can select to see floor plans of
individual buildings and the layout of electrical equipment in that
building. When a piece of equipment in the floor plan is
selected, it brings up a realistic view of the equipment, where
managers can access critical performance data such as input and output
voltages and monitoring alarms.
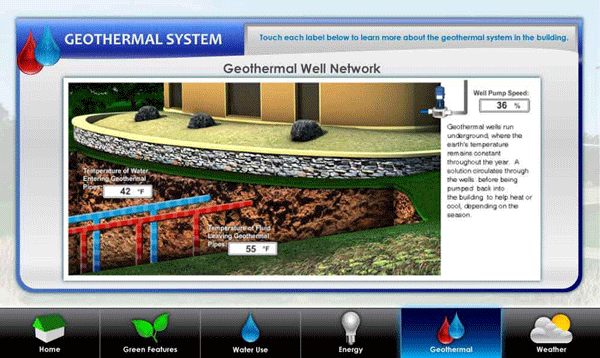
Take Viewers Behind the Scenes
Graphics and animated demonstrations simplify complicated concepts and
allow viewers to go behind the scenes to see operations that may take
place underground or out of the typical eye’s view. This example
demonstrates how a geothermal well network functions, showing the
piping beneath the building to illustrate how the water is pumped in
and out to heat and cool the building. It also provides technical data,
showing the speed of the well’s pumps, and the temperature of the water
as it enters and leaves the pipes. Animated demonstrations
are a great way to demonstrate how mechanical equipment and building
features like rainwater harvesting, daylighting or photovoltaic systems
function. More examples can be viewed at
www.qagraphics.com/interactive-development/multimedia-solutions.html.
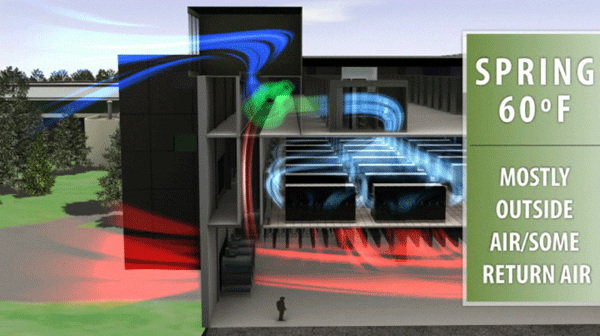
Make the Invisible Visible
Graphics can demonstrate features that you would never otherwise be
able to see. This example is part of an animated video that
explains how a data center conserves energy. The video shows how
invisible energy, air flow and temperature changes impact the data
center’s efficiency. The video illustrates how the electric
current flows through transformers to the data center campus, and shows
the layout of the mechanical room and air handling units used to cool
the building. The graphic below takes the intangible concept of
air flow and provides a clear view of how air leaves and enters the
building and at what temperature. The full video can be viewed
at:
www.qagraphics.com/interactive-development/multimedia-solutions.html.
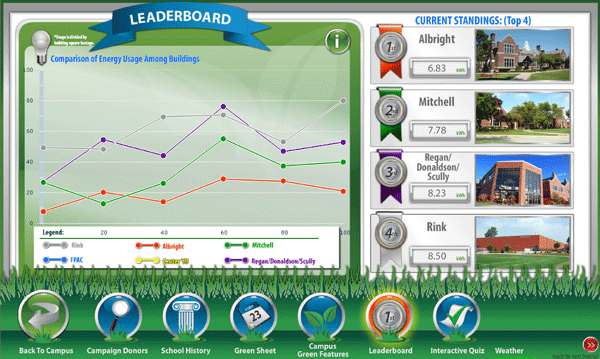
Building Performance
Graphics also make building performance data visible and more
accessible. Dashboards can be used to display building performance
data, simplifying the data so that a general audience, even children,
can see and understand how much electricity your building is using. For
these types of displays, the data is typically already in place, it
just needs a creative outlet that people can relate to. The
example below illustrates a school campus and their efforts to conserve
energy. A leaderboard displays real-time energy use for each of the
campus’ buildings, and allows the students/faculty to see which
building is the most efficient.
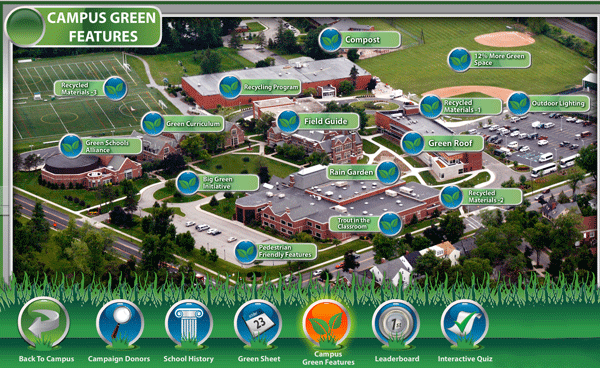
In addition to providing real-time resource use, creative graphics can
provide education about a building’s efficiencies or sustainable
features in place. Below demonstrates the green features that are in
place at a school. The interactive map identifies where sustainable
features are located throughout the campus, and when viewers select a
feature, graphics and additional information is provided. A variety of
interactive graphics like this can be used to engage viewers, through
demonstrations, quizzes, videos, etc.
These examples briefly illustrate how graphics are used to explain how
unseen or invisible concepts function. Providing creative tools
such as these is QA Graphics’ speciality. To learn more about how
graphics can be used in your day-to-day functions and to showcase your
products and services, visit www.qagraphics.com or contact
serdman@qagraphics.com.
[an error occurred while processing this directive]
[Click Banner To Learn More]
[Home Page] [The Automator] [About] [Subscribe ] [Contact Us]