May 2010
![]()
AutomatedBuildings.com
[an error occurred while processing this directive]
(Click Message to Learn More)
May 2010 |
[an error occurred while processing this directive] |
|
|
|
Let’s talk about gold mining. People have mined gold for thousands of years, in a variety of ways. Most methods did a good job of extracting the nuggets and larger flakes, but they left behind a lot of dirt, rocks, and other junk called “tailings”.
|
|
|
|
|
|
|
|
|
|
|
|
|
[an error occurred while processing this directive] |
|
|
|
|
|
|
|
|
|
|
|
|
|
|
|
[an error occurred while processing this directive] |
The tailings still contained gold. Sometimes more gold got left behind than was extracted. The leftover gold was too difficult to get at. But in the last century, “reprocessing” techniques were developed that made it profitable to get most of the gold out of the tailings.
You may be asking “what does gold mining have to do with AutomatedBuildings.com”? It offers a good analogy to something we are seeing in the field of building energy management. DOE estimates that total energy costs for US commercial buildings will be almost $200 billion in 2010 alone. Technologies that Ken Sinclair often writes about – smart grid, wireless, web services, and open standards can take a big bite out of this total each year. That’s a lot of gold.
Companies are already deploying powerful apps which extract the most valuable nuggets and flakes – real-time intelligent controls (including demand response tools), dashboards which combine real-time energy use with time-of-day pricing, continuous monitoring and alerting, and others.
In their search for the nuggets, these applications sift through huge amounts of data (the “ore”, if you will). This usually includes interval energy use (e.g. 15 minute kWh or kW readings). After the nuggets are extracted, this data is stored in databases, rarely to be looked at again. Yes, these are the tailings.
Just as in gold mining, there’s a lot of value left in the energy data tailings. We analyzed a year of interval use data for 588 electric, chilled water, and steam meters in commercial and industrial facilities in the US and Canada. Potential operational savings opportunities were identified in 93 facilities, totaling 2.3 million dollars. The average avoidable savings was US$24,600 and 153 tons of CO2 emissions per load.
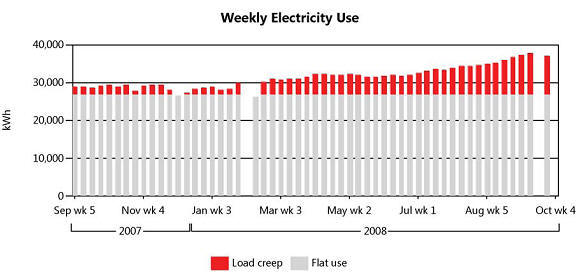
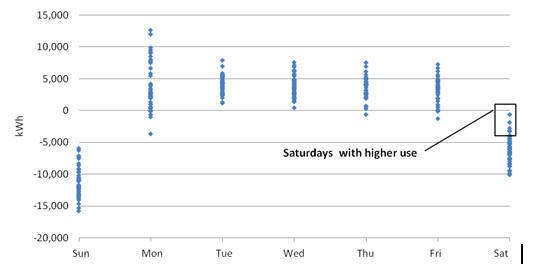
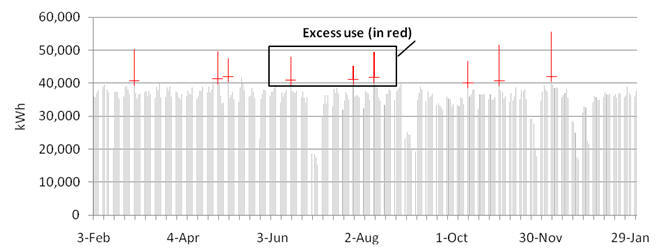
“Load creep”, a steady gradual increase in energy use over a year occurred in 22 facilities, resulting in 1.4 million dollars of added energy costs. 57 facilities saw a significant number of days of unexpectedly high use, estimated at 590 thousand dollars of added costs. The third leading cause of excess energy use was occasional high use on weekends
How were these savings opportunities identified? By systematically analyzing the energy data tailings from a variety of perspectives:
• Long term – These are patterns and trends which span weeks or months, such as seasonal changes, load creep, multi-week spikes, and other persistent changes. Real-time monitoring often misses these, because they happen too gradually to trigger their thresholds.
• Day-of-week – Does energy use consistently vary by day of week? For example, is weekend use significantly lower than weekday use? Do some days of the week stick out as unusually high (or low)? You need to look at months of historic data to establish these patterns and find anomalies.
• Daily – Are there days which have unusually high energy use after adjusting for seasonal and weekly patterns? Do they occur in clusters, or on a particular day of the week (for example, do most high use days occur on Mondays?).
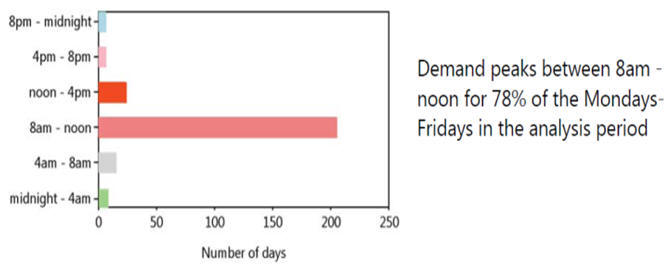
• Hourly – When does the load most often peak, in the middle of the day or late at night? Is the load flat or spiky? Does the load profile change from weekday to weekend?
None of these steps are all that complicated. You could do most of them with a spreadsheet. Let’s say it would take you 1-2 hours to analyze a year of interval energy data for a load, including quantifying any savings opportunities as avoidable costs and greenhouse gas emissions.
If we use the survey of 588 meters as a guide, you can expect to find significant savings in 25-30% of your loads. That means it will take between 3 to 8 hours of digging in the tailings for each bit of gold. And if you oversee a large portfolio of facilities, well, welcome to the mining business!
(Quick aside here – there is value from analyzing the 70-75% of loads which don’t reveal savings opportunities. At least you know that these facilities are operating as expected. It’s like getting a clean bill of health from your doctor after your annual check-up.)
[an error occurred while processing this directive] Few facility or energy managers can spend this kind of time poring over historic energy data. As with gold mining, we need reprocessing techniques which are inexpensive and automated, requiring little or no effort from facility or energy managers. Ideally, we need a reprocessing “robot” which we can set loose on a mountain of energy data tailings (OK, now I’m visualizing “Wall-E”, the cute animated robot from Pixar, which has nothing to do with gold mining).
Happily, the analytic steps outlined above (long term, day-of-week, daily, hourly) can be automated. They can be used on any type of energy commodity – electricity, natural gas, steam, chilled water, etc. And they can be applied to any type and size of load – residential, commercial, institutional, or industrial.
The only input needed by our reprocessing robot is the raw interval energy data. You don’t have to provide floor areas, type of use, occupancy schedules, installed equipment inventories, nothing. So whether you oversee a single facility or many, just point the robot at the tailings and say “go”.
So what form might this robot take, and how do you connect it with your energy data? One model is the approach we have taken at EnergyAI™ -- as a service. Historic energy data is usually stored in an energy management system (EMS) hosted by your utility, your energy services partner, or in-house. You can export data from an EMS in a variety of formats. Then electronically forward the data to EnergyAI™ and receive a report with the findings by email. EnergyAI™ is discussed in more detail in the April issue of AutomatedBuildings.com - What Secrets Lurk In the 98% of Energy Data that’s Never Looked At?.
Another approach is to embed the reprocessing robot directly into an EMS. Then in addition to the wonderful real-time capabilities offered by the EMS, it can automatically provide you with an annual “check-up” of your facilities’ operating patterns.
Regardless of the approach, the end result is extracting the gold in your energy data tailings to reduce operating costs and greenhouse gas emissions. Without getting your hands dirty.
About the Author
Dave Krinkel is the founder of EnergyAI (www.energyai.com),
based in Berkeley, CA. In 1978 he was a researcher in the pioneering Energy
Efficient Buildings team at Lawrence Berkeley National Lab. For the last 25
years, Dave has developed energy analysis tools for utilities, ESCO’s, and a
wide variety of industrial, commercial, and institutional end users. Prior to
EnergyAI, Dave held senior positions at Itron, Silicon Energy, and SRC Systems.
He can be reached at
dkrinkel@energyai.com.
[an error occurred while processing this directive]
[Click Banner To Learn More]
[Home Page] [The Automator] [About] [Subscribe ] [Contact Us]