|
December 2015
Article
AutomatedBuildings.com
|
[an error occurred while processing this directive]
(Click
Message to Learn More)
|
|
Evolving User Experience in the IoT Building
Our
IoT visualization solutions need to be flexible enough to serve
relevant data to each stakeholder in the format and on the device they
choose to use.
|

Greg Barnes
Vice President,
Sales and Marketing, Activelogix, LLC |
The
Internet of Things is comprised of sensors, connectivity, people and
their processes. Our need for interaction with these “Things” is
creating opportunity to evolve the user experience with new types of
applications and services that consume the data and provide tangible
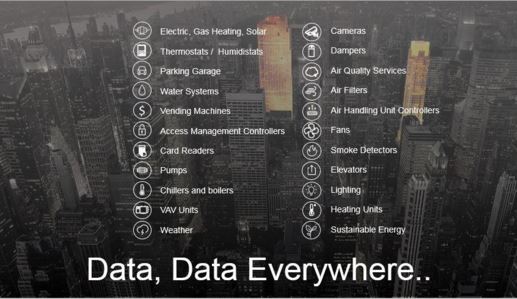
benefits such as reducing cost/time or improving a process. The volume
of connected devices continues to explode and includes devices from the
many different systems listed in Figure 1 as well as other
non-traditional systems:
Figure
1 Growing List of Devices Sharing Data
As more of our equipment and automated systems are
increasingly
connected, they share IoT data that is potentially very useful to a
wide audience including: design professionals, construction management,
owner and occupants. Having relevant, real-time data from these IoT
building level devices can often lead to a greater understanding of
building operation versus design or occupant needs and can produce
tangible benefits such increased operating savings, improved
environmental footprint or tenant retention. The list of key
stakeholders taking advantage of this relevant data continues to grow
as the data becomes more available and the user interface becomes more
position oriented. New stakeholders (see Figure 2) with need for more
of the relevant data include:
Figure
2 Growing List of Stakeholders Using Building
Data
In an ideal world, each type of user (i.e. CEO, Human
Resources, Energy
Manager, Front Desk Security, Sustainability Coordinator, and
Maintenance Technician, etc.) will consume data from a portion of smart
devices in a way unique to their needs. Some stakeholders will need
real time alerts when problems occur; others may want monthly summaries
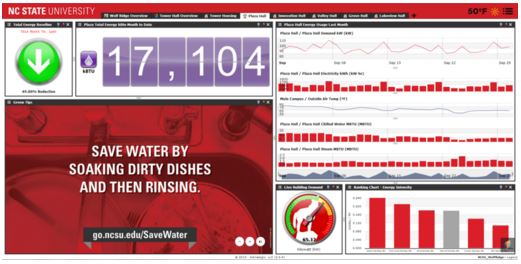
of usage versus goal. Other users will seek to impact change by
sponsoring competition to reduce waste (see Figure 3 for College
Dashboard example). Our IoT visualization solutions need to be
flexible enough to serve relevant data to each stakeholder in the
format and on the device they choose to use.
Figure 3 – Customized IoT Collegiate Visualization
[an error occurred while processing this directive]
The challenge facing our industry is the rapid
development of software
applications that serve to connect a single manufacturer’s set of
building devices and only offer visualization of their unique
subsystem. It is often a method to “lock” a manufacturer’s devices in
by creating barriers to competitive bidding. It’s common for some
stakeholders have a sole focus on access to data from devices in his or
her domain, but it’s just as likely that others within the organization
would find this data useful in other unique applications. For instance,
occupancy data is needed by security, HR and environmental systems
departments. Many of the devices offered today have some form of
industry standard connectivity, but how do we cost effectively access
all data, customize the visualization and share the information with
the many consumers that only need portions of the data? Does the tool
allow the end user to manipulate the visualization to their needs?
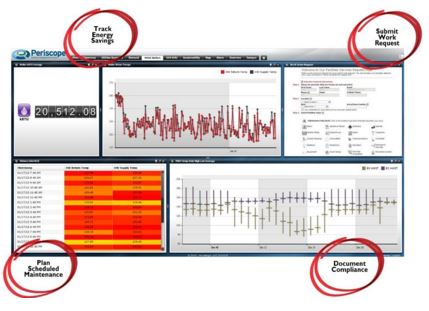
Today we expect that each stakeholder should be able to visualize data
on a device of choice – phone, tablet or desktop. See Figure 4 for
Phone Tablet and Server Visualization examples.
Figure
4 IoT Data Visualization for Cell, Tablet and
Server Platforms


Fortunately, our efforts to standardize are beginning to pay off and
forward thinking companies are providing cost effective tools that
allow the end user and systems integrators the ability to combine data
from many devices and customize the view of data to each interested
stakeholder. The successful industry tools will allow each unique IoT
stakeholder to choose data from multiple devices, choose live and/or
historical data sources, and choose not to worry whether the
visualization platform is mobile or desktop. Be sure to examine
visualization tools at ASHRAE with these goals in mind!
About the Author
Greg
has 29 years of experience in the building and energy automation
markets. He currently leads the Periscope Sales and Marketing efforts
at Activelogix. Greg started his career in Building Automation with
Johnson Controls and later led the non-regulated Energy Services group
of Carolina Power & Light. In 1998 he joined the software start-up
Tridium, where he helped build the Distribution and OEM channels for
the Niagara Framework technology. In 2006, Greg joined Activelogix as
Vice President of Sales and he currently leads the marketing effort of
Periscope and IoT initiatives.
footer
[an error occurred while processing this directive]
[Click Banner To Learn More]
[Home Page] [The
Automator] [About] [Subscribe
] [Contact
Us]